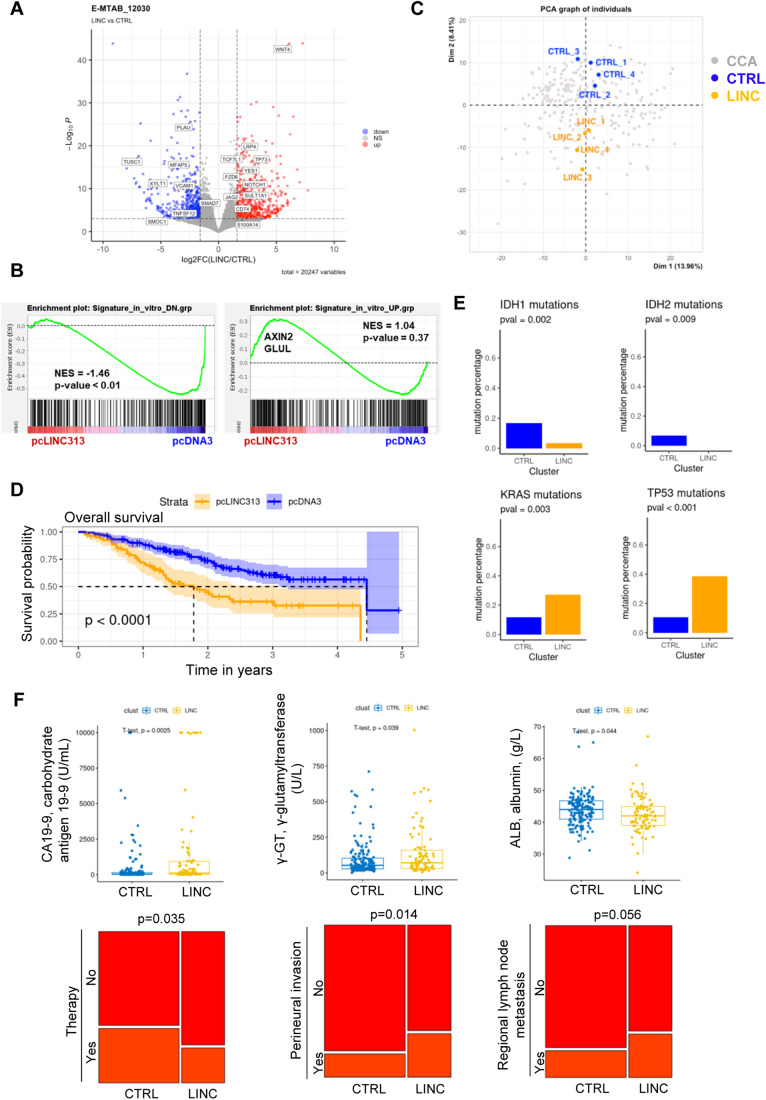
Figure 8. In vivo LINC00313-associated gene signature predicts outcome in CCA patients.
(A) Volcano plot showing differentially expressed genes in control (n = 4) and LINC00313 (n = 4) resected xenograft tumours. Genes significantly differentially expressed between the two conditions (fold change > 3 and FDR < 0.001) are indicated in red (upregulated) and blue (downregulated), respectively. (B) GSEA using gene signatures established in vitro (UP and DN regulated genes) and the gene expression profiles established in vivo (i.e. in tumours from xenografted mice derived from HuCCT1 cells overexpressing pcLINC313 versus pcDNA3 control vector). (C) Principal component analysis (PCA) of 255 iCCA samples from the publicly available from the NODE Project=OEP001105). The four control (CTRL) and LINC00313 (LINC) samples were integrated as supplementary individuals in the PCA analysis (FactoMineR R package). (D) Comparison of the overall survival (OS) between CCA patients in CTRL (pcDNA3, n = 154) and LINC (pcLINC00313, n = 101) clusters based on HCPC. The OS was higher in CTRL patients (n = 149) than in LINC patients (n = 95) with 4.36 years (95% CI, 4,36 to not reached) versus 1.83 years (95% CI, 1.39 to not reached), respectively; P = 2e-05 (E) Mutational analysis performed on 249 CCA samples from the publicly available OEX011131 NODE WES dataset (NODE Project = OEP001105). IDH1 mutated patients are more frequent in CTRL versus LINC (n = 26/149, n = 4/100, p = 1.22e−03). IDH2 mutated patients are more frequent in CTRL versus LINC (n = 11/149, n = 0/100, p = 3.61e−03). KRAS mutated patient are less frequent in CTRL versus LINC (n = 14/149, n = 29/100, p = 1.22e−04). TP53 mutated patient are less frequent in CTRL versus LINC (n = 16/149, n = 35/100, p = 5.05e−06). (F) Clinical data analysis between CTRL (n = 154) and LINC (n = 101) clusters from OEP001105 NODE dataset (n = 255). Box plots are defined as follows: For CA19-9 in CTRL group; min: 0.6, lower whisker: 0.6, 25th percentile: 12.6, median: 32.6, mean: 349.9, 75th percentile: 109.9, upper whisker: 229.8, max: 10,000. For CA19-9 in LINC group; min: 0.6, lower whisker: 0.6, 25th percentile: 26.2, median: 125.8, mean: 1437.4, 75th percentile: 928.2, upper whisker: 2278, max: 10,000. For γ-GT in CTRL group; min: 1.6, lower whisker: 1.6, 25th percentile: 26.0, median: 49.0, mean: 91.1, 75th percentile: 97.0, upper whisker: 195.0, max: 712.0. For γ-GT in LINC group; min: 5.2, lower whisker: 5.2, 25th percentile: 35.0, median: 80.0, mean: 140.7, 75th percentile: 167.0, upper whisker: 364.0, max: 1003.0. For ALB in CTRL group; min: 29, lower whisker: 34, 25th percentile: 41, median: 44, mean: 43.9, 75th percentile: 46, upper whisker: 51, max: 68. For ALB in LINC group; min: 24, lower whisker: 33, 25th percentile: 40, median: 42, mean: 42.6, 75th percentile: 45, upper whisker: 52, max: 67. Data information: In panel (A) the volcano plot was created based on a differential analysis (LINC vs CTRL) performed on 20,247 genes with DESeq2 R package. Normalisation of the expression data was performed by variance stabilizing transformation (VST). For calculating the false discovery rate (FDR) the p-values adjustment method was BH (Benjamini and Hochberg, 1995). In panel (B) the Kolmogorov–Smirnov test was used for statistical analysis. In panels (C–F) two groups of CCA samples were defined by HCPC (Hierarchical Clustering on Principal Components) performed with the FactoMineR R package on the PCA analysis results. Groups were labelled CTRL and LINC in accordance with the projected supplementary individuals. In panel (D) the Kaplan–Meier method was used to estimate the survival distributions. Log-rank tests were used to test the difference between survival groups. Analyses were carried out with the survival and survivalROC R packages. 11 observations were deleted due to missingness. In panel (E) comparison of the mutation percentages between CTRL and LINC patients was assessed with Fisher’s exact tests. In panel (F) for quantitative variables, the difference in means was assessed with two sample t-tests, whereas for qualitative variables, the independence was assessed with Fisher’s exact tests. Source data are available online for this figure.

