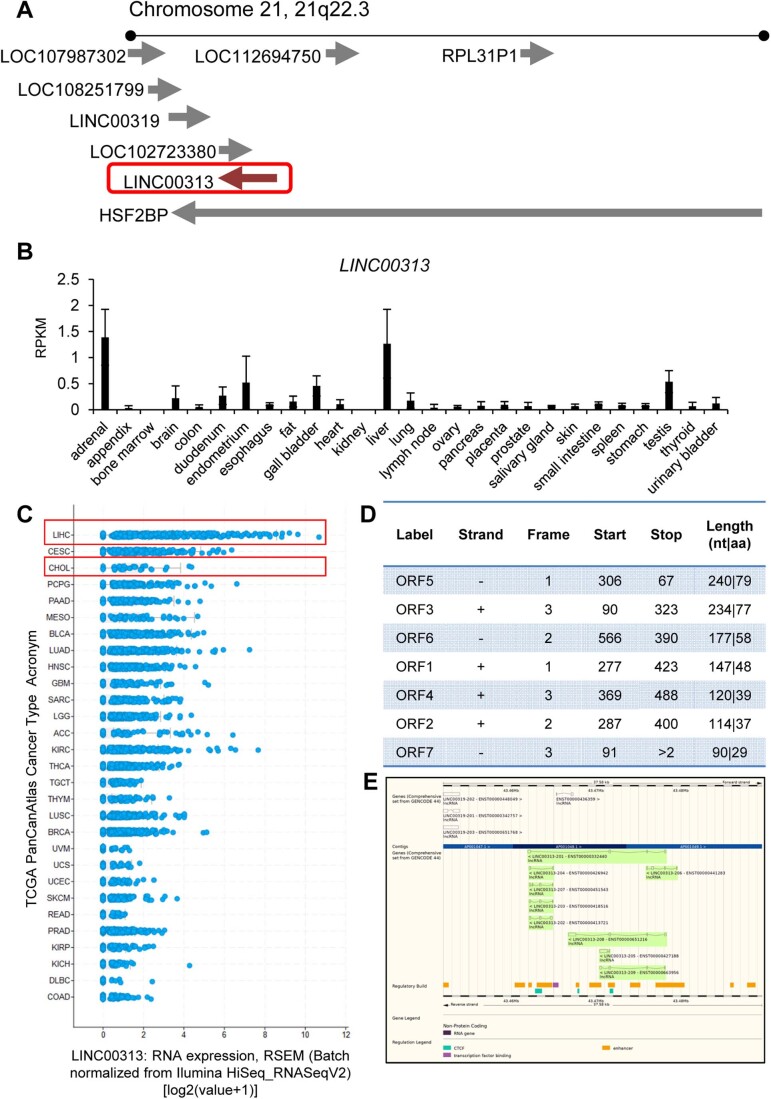
Figure EV1. Characterization of LINC00313.
(A) Schematic representation of LINC00313 genomic locus on chromosome 21. (B) LINC00313 expression profile among 27 different human tissues from 95 individuals, as determined by RNA-seq (accession: PRJEB4337). (C) LINC00313 expression levels among 29 cancer types from the PanCancer Atlas of TCGA, sorted from the highest (top) to the lowest (bottom) expression. (D) ORF analysis of LINC00313 lncRNA sequence, using the Open Reading Frame Finder tool from NCBI. (E) Snapshot of the LINC00313 genomic locus from the Ensembl database showing the different splice variants. Data information: In panel (B) LINC00313 expression is presented in Reads Per Kilobase per Million mapped reads. In panel (C) LINC00313 expression is quantified with RSEM and displayed in logarithmic scale.

