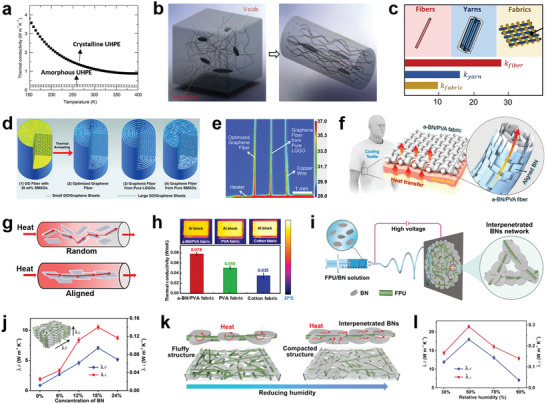
Figure 7.

Thermal conductive cooling textiles with high crystallinity, orientation, and enhanced thermal conductivity. a) Thermal conductivity of crystalline and amorphous UHPE at 0.05 GPa from 150 to 400 K. Reproduced with permission.[ 85 ] Copyright 2014, Elsevier. b) Bulk PE containing chain ends, entanglements, voids and defects, and stretched PE microfiber. Reproduced with permission.[ 90 ] Copyright 2010, Springer Nature. c) Thermal conductivity research of the UHMW‐PE fiber, yarns, and woven fabrics, respectively. Reproduced with permission.[ 93 ] Copyright 2020, American Chemical Society. d) Schematics of the “intercalated” structure of the GO fibers and graphene fibers. e) A thermal image showing rapid heat transport on the optimized graphene fiber. Reproduced with permission.[ 100 ] Copyright 2015, The American Association for the Advancement of Science. f) Schematic illustration of the BN/PVA composite fabric. g) Schematic illustration of the proposed thermal conduction model of the a‐BN/PVA fiber. The aligned BNNSs form continuous thermally conductive pathways along the fiber direction. The red lines indicate heat transfer paths. h) Measurements of the thermal conductivities of the a‐BN/PVA fabric compared with others. Reproduced with permission.[ 105 ] Copyright 2017, American Chemical Society. i) Schematic illustration of the fabrication and structure of thermos‐conductive nanofibrous membranes. j) In‐plane and cross‐plane thermal conductivity of the FPU/BN membrane. k) Diagram of heat conduction of the FPU/BN membranes fabricated under high and low humidity. l) In‐plane and cross‐plane thermal conductivity of membranes fabricated under different relative humidities. Reproduced with permission.[ 106 ] Copyright 2020, American Chemical Society.
