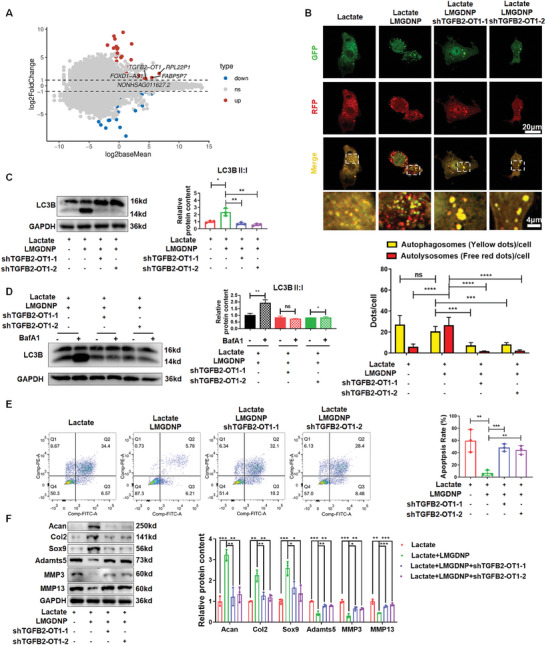
Figure 6.

TGFB2‐OT1 mediates LMGDNPs‐induced autophagy in NPCs. A) Maplot of differentially expressed genes between the lactate and lactate + LMGDNP groups. MA plots (M = log2 fold change and A = log2 baseMean average). Red and blue dots in the MA plots indicate differentially upregulated and downregulated genes (p < 0.05) in NPCs cultured with LMGDNPs or not. The top 5 upregulated genes with the highest expression abundances are labeled. B) Representative fluorescence images showing the autophagosomes (yellow dots, GFP+ RFP+) and autolysosomes (free red dots, GFP− RFP+) in NPCs transfected with shTGFB2‐OT1 and exposed to lactate and LMGDNPs for 24 h. Scale bars: 20 µm and 4 µm. Quantification of the number of autophagosomes and autolysosomes per cell is shown as the mean ± SD. Cells were from 3 independent experiments. ns, no significance; ***p < 0.001, ****p < 0.0001 between groups. C) Western blot analysis of LC3B in NPCs transfected with shTGFB2‐OT1, which were treated with lactate and LMGDNPs for 24 h. D) LC3B II:I expression in NPCs transfected with shTGFB2‐OT1, which were treated with lactate and LMGDNPs for 24 h and cultured with or without BafA1 for 4 h. E) Cell flow cytometry analysis of the apoptotic rate of NPCs. The results are shown as the mean ± SD, n = 3, ***p < 0.001, ****p < 0.0001. F) Western blot analysis of matrix‐degrading proteases and matrix anabolic factors. Data are presented as the mean ± SD, n = 3, ns, no significance, *p < 0.05, **p < 0.01, ***p < 0.001 between groups. GDNP, glucose‐rich nucleus pulposus matrix hydrogel‐based microspheres. LMGDNP, LOX‐MnO2 nanozyme‐loaded glucose‐rich nucleus pulposus matrix hydrogel‐based microspheres.
