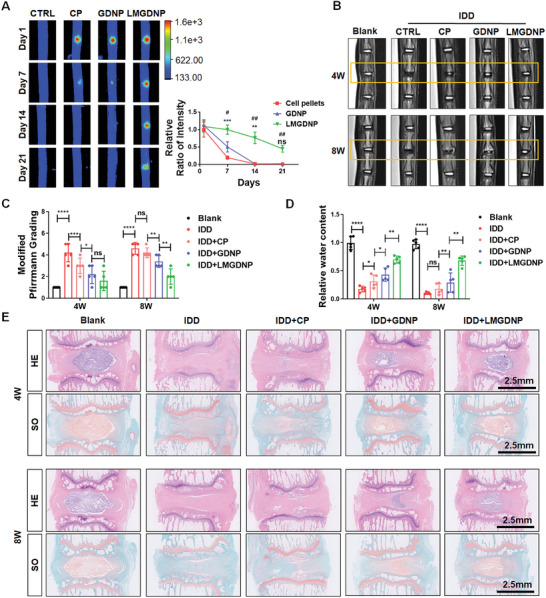
Figure 7.

Regenerative effects of LMGDNPs on lactate‐induced IDD. A) Fluorescence images showing the fluorescence intensity after delivering DiR Iodide‐labeled BMSCs by GDNPs or LMGDNPs at Day 1, Day 7, Day 14, and Day 21. Data are presented as the mean ± SD, n = 3. Ns, no significance; **p < 0.01, ***p < 0.001, GDNPs compared to cell pellets (CP); #p < 0.05, ##p < 0.01, LMGDNPs compared to CP. B) Representative images of T2‐weighted MRI of rat tails. Boxes indicate the operated disc. C) Modified Pfirrmann MRI grades for each group. D) Quantitative evaluation of T2‐weighted signaling (water preservation in NP tissues). E). Histological images based on HE and SO staining. Scale bar: 2.5 mm. Data are presented as the mean ± SD, n = 5, ns, no significance, *p < 0.05, **p < 0.01, ***p < 0.001, ****p < 0.0001 between groups. CTRL, control. CP, cell pellets. IDD, intervertebral disc degeneration. LM, LOX‐MnO2 nanozyme. GDNP, glucose‐rich nucleus pulposus matrix hydrogel‐based microspheres. LMGDNP, LOX‐MnO2 nanozyme‐loaded glucose‐rich nucleus pulposus matrix hydrogel‐based microspheres.
