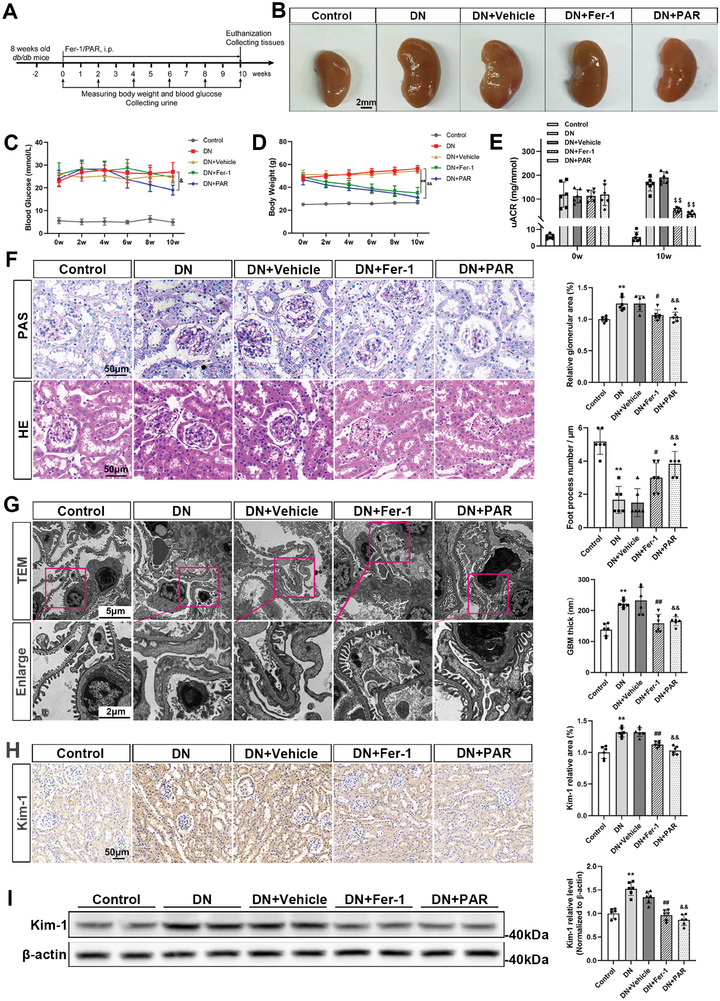
Figure 3.

VDR activation attenuated renal dysfunction in DN mice. The animal experiment was designed as shown in the schematic diagram. db/db mice aged 10 weeks were randomized to receive a daily i.p. injection of Fer‐1 (5 mg kg−1 per day), PAR (0.1 µg kg−1 per day) or an equal amount of vehicle for 10 weeks (A). Changes in the renal volume of mice in different groups at the endpoint (B). Blood glucose levels (C) and body weights (D) of mice were examined at the indicated timepoints. Mouse uACRs were tested at 0 and 10 weeks (E). PAS staining and HE staining of murine kidney tissues in different groups. Semiquantitative analysis of the glomerular area in different groups. Scale bar = 50 µm (F). Representative TEM images of glomerular lesions in db/db mice and comparative analysis of the GBM foot process number per micrometer and the thickness of the GBM. Scale bar = 5 or 2 µm (G). Immunohistochemical staining and semi‐quantification of Kim‐1 expression in mouse kidney specimens. Scale bar = 50 µm (H). Western blotting analysis of Kim‐1 expression in renal tissue lysates and the densitometric analysis of the blots. β‐actin served as a loading control (I). Each bar represents the mean ± SD of the data derived from six independent experiments (n = 6). ** p < 0.01 versus Control group; # p < 0.05, ## p < 0.01 versus DN group; & p < 0.05, && p < 0.01 versus DN group; $$ p < 0.01 versus baseline of each group.
