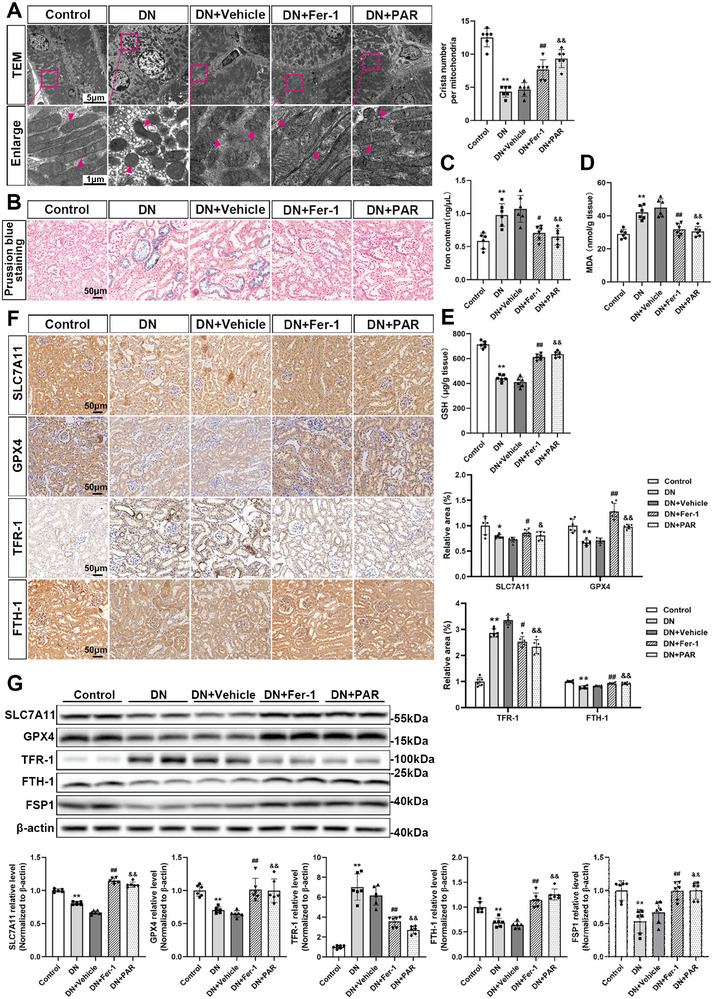
Figure 4.

VDR activation inhibits ferroptosis in DN mice. Mitochondrial morphology in renal tissues of different groups as indicated in TEM images. The arrow indicates microscopic changes in mitochondria. Absolute counting of the number of cristae per mitochondria. Scale bar = 5 or 1 µm (A). Prussian blue staining of mouse kidney tissues in each group, scale bar = 50 µm (B). The iron (C), MDA (D), and GSH (E) contents in mouse kidney tissue lysates. Representative microscopic images are shown for immunohistochemistry staining for SLC7A11, GPX4, TFR‐1, and FTH‐1 of kidney tissues in different groups, followed by densitometric analysis of the positive area. Scale bar = 50 µm (F). Western blotting analysis of SLC7A11, GPX4, TFR‐1, FTH‐1, and FSP1 in different groups of renal tissue and densitometric analysis of the blots. β‐actin served as a loading control (G). Each bar represents the mean ± SD of the data derived from six independent experiments (n = 6). * p < 0.05, ** p < 0.01 versus Control group; # p < 0.05, ## p < 0.01 versus DN group; & p < 0.05, && p < 0.01 versus DN group.
