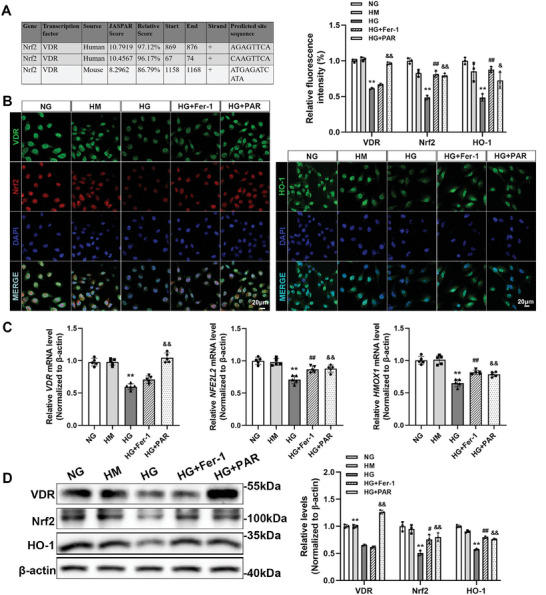
Figure 5.

VDR activation upregulated the expression of Nrf2 and HO‐1 in HG‐cultured HK‐2 cells. Predicted VDR binding sites in human and mouse Nrf2 gene promoter regions by JASPAR online analysis (A). Immunofluorescence staining was used to determine the expression and localization of VDR, Nrf2, and HO‐1. Quantitative analysis of the fluorescence intensity per fixed field. Scale bar = 20 µm (B). The relative mRNA levels of VDR, NFE2L2, andHMOX1 of HK‐2 cells determined by qRT‐PCR. ACTB served as a loading control (C). Western blotting was performed to measure the protein levels of VDR, Nrf2, and HO‐1, followed by densitometric analysis of the blots. β‐actin served as a loading control (D). Each bar represents the mean ± SD of the data derived from three independent experiments (n = 3). ** p < 0.01 versus Control group; # p < 0.05, ## p < 0.01 versus DN group; & p < 0.05, && p < 0.01 versus DN group.
