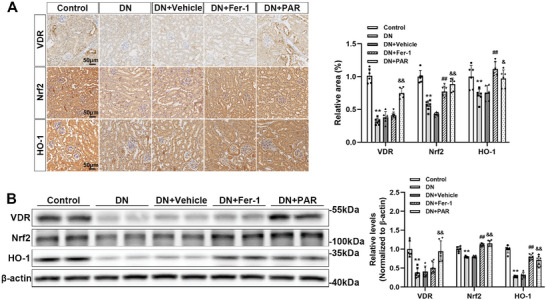
Figure 6.

VDR activation upregulated the expression of Nrf2 and HO‐1 in DN mice. Representative microscopic images are shown for immunohistochemistry staining for VDR, Nrf2, and HO‐1 in kidney tissues, followed by densitometric analysis of the positive area. Scale bar = 50 µm (A). Western blotting analysis of VDR, Nrf2, and HO‐1 in renal tissue of different groups and the densitometric analysis of the blots. β‐actin served as a loading control (B). Each bar represents the mean ± SD of the data derived from six independent experiments (n = 6). ** p < 0.01 versus Control group; ## p < 0.01 versus DN group; & p < 0.05, && p < 0.01 versus DN group.
