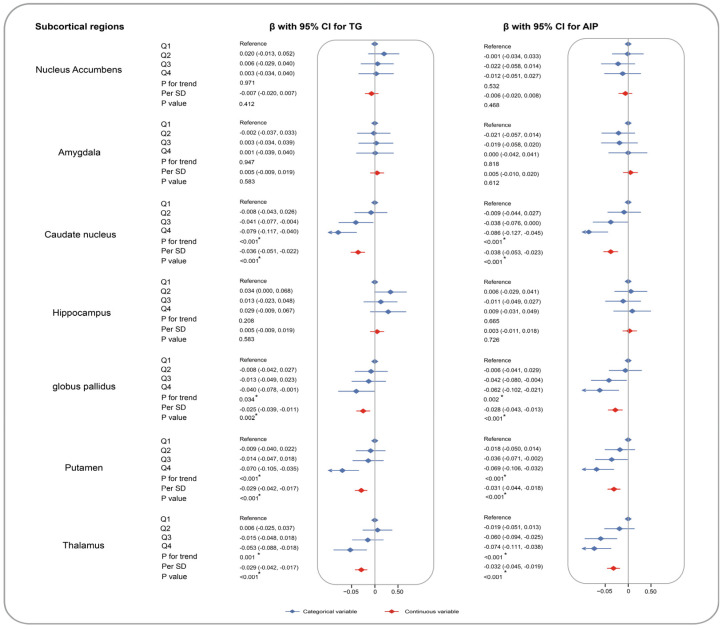
Figure 2.
Associations of TG and AIP with brain subcortical imaging phenotypes. The brain subcortical imaging phenotypes included volumes of nucleus accumbens, amygdala, caudate nucleus, hippocampus, globus pallidus, putamen, and thalamus. We conducted the analyses to assess the associations of TG and AIP with brain subcortical structure among 25,057 participants with MRI data. Multiple linear regression models were built with adjustments for age, sex, IMD, WHR, healthy lifestyle, SBP, DBP, HbA1c, LDL-C, TC, prevalence of hypertension, diabetes, atrial fibrillation, and stroke. In our analyses, βs and corresponding 95% CIs were estimated with TG and AIP as categorical and continuous variables. The red points indicate HRs per SD, and the blue points are categorized HRs. Brain structure marked with asterisks indicates the associations of statistical significance.

