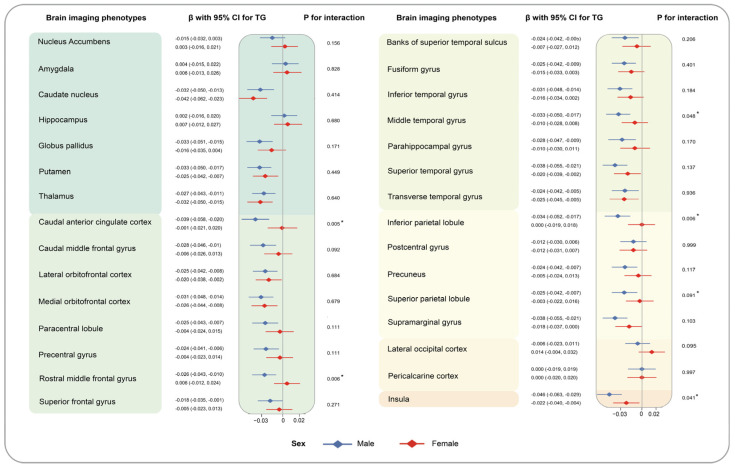
Figure 4.
Associations of TG with brain imaging phenotypes stratified by sex. Results were presented as βs with corresponding 95% CIs with AIP as a continuous variable. P for interaction for each subgroup was calculated to evaluate comparability through the multiplicative term in the model. Brain structure marked with asterisks indicates the associations of statistical significance.

