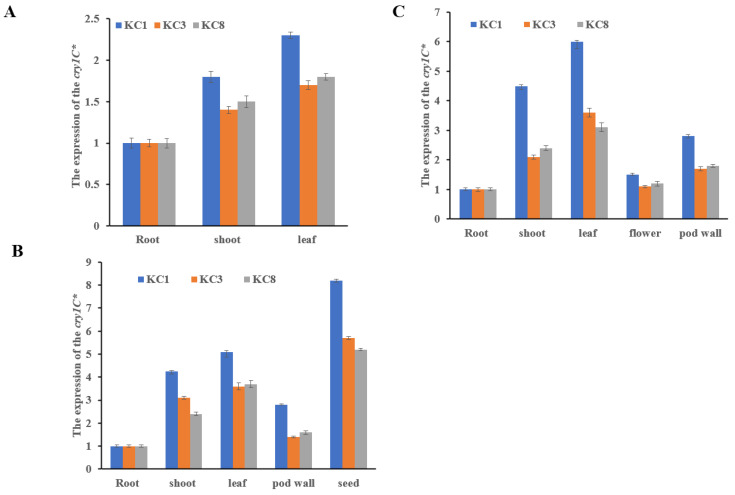
Figure 3.
Expression level of cry1c* at different developmental stages. The expression level of cry1c* was quantified using real-time qPCR. (A) V2 developmental stage; (B) R3 developmental stage; (C) R6 developmental stage. The numbers on the Y-axis represent the fold change in relative expression level analyzed using the 2^-ΔΔCt method. Error bars indicate SD.

