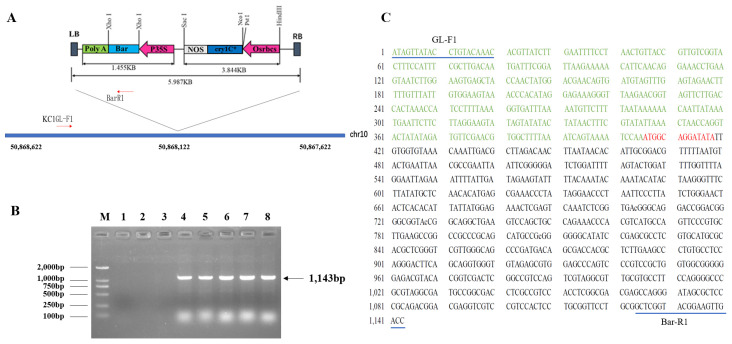
Figure 7.
Transgene insertion sites in the transgenic line KC1. (A) Genome location of transgene insertion in the transgenic line; (B) electrophoresis gel depicting PCR test with specific primers. M, DNA Ladder; 1, 2, 3, 4, 5, 6, 7, and 8 are negative control, distilled water control, plasmid sample, and five T3 individual plants of KC1, respectively; (C) confirmation of endogenous genes completeness. The soybean genomic sequence is highlighted in green; unknown insertion sequence is labeled in red; the left flanking region sequence of T-DNA is highlighted in black.

