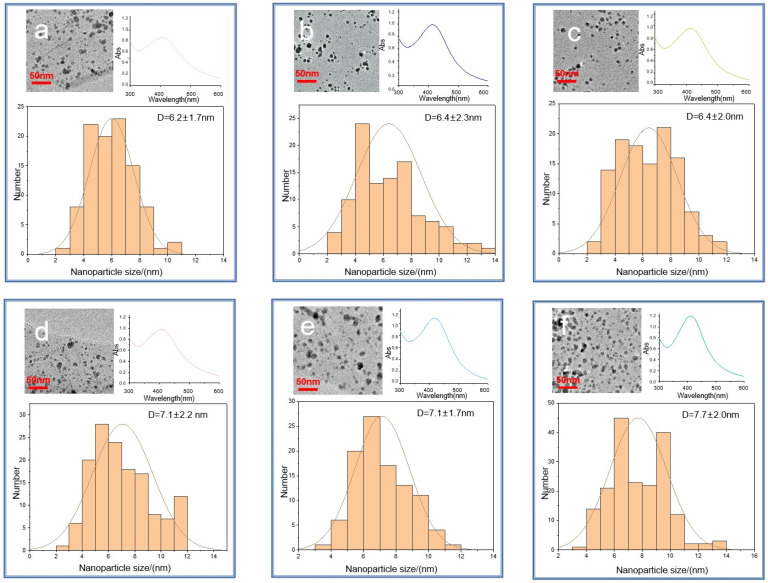
Figure 6.
TEM images of the six Ag-HS systems used in this study obtained under MW irradiation (a–c) and conventional heating (d–f): (a) MW-CHG-AgNPs (6.2 ± 1.7) nm; (b) MW-CHL-AgNPs (6.4 ± 2.3) nm; (c) MW-CHP-AgNPs (6.4 ± 2.0) nm; (d) NMW-CHG-AgNPs (7.1 ± 2.2) nm; (e) NMW-CHL-AgNPs (7.1 ± 1.7) nm; (f) NMW-CHP-AgNPs (7.7 ± 2.0) nm. The histograms show the particle size distribution. The insets in the right upper corner show UV–VIS spectra at the final stage of synthesis.

