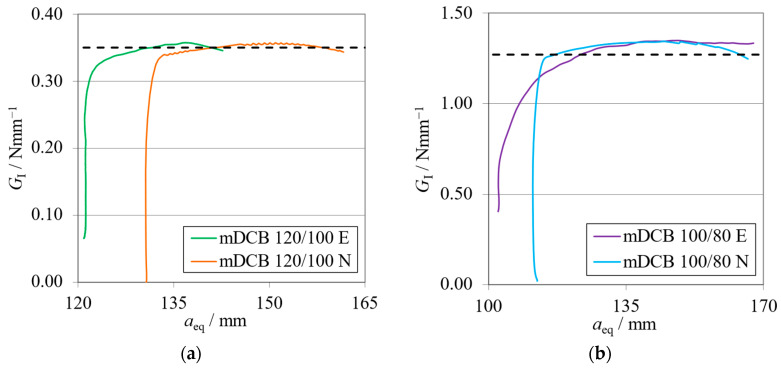
Figure 9.
R-curves related to the Balanced mDCB specimen with hII = 9 mm. Numerical (N) versus experimental (E) results. The black dashed line represents the mean GIC value obtained with standard methods (Table 4). (a) Brittle adhesive; (b) Tough adhesive.

