Figure 4.
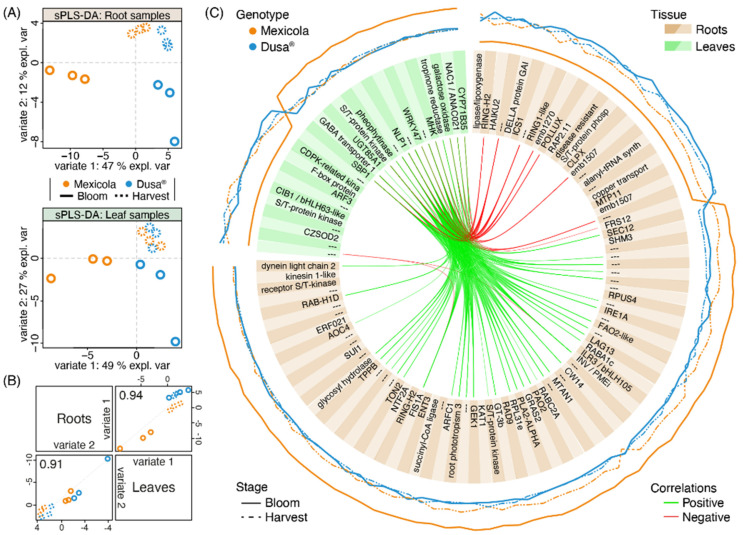
Transcriptomic integration analysis between root and leaf samples of avocado trees cv. Hass grafted on two types of rootstocks, Mexicola (seedling) and Dusa® (clonal). (A) Sparse partial least square discriminant analysis (sPLS-DA) with selected variables for root (upper side) and leaf (lower side) transcriptomic datasets. (B) Scatterplot from plotDiablo displaying the first (upper diagonal) and second (lower diagonal) sPLS-DA variates with Pearson correlations between root and leaf transcriptomic datasets. (C) CircosPlot showing the root and leaf selected transcripts for variate 1. The expression values of each transcript are plotted on the outside part of the circosPlot. Positive and negative correlations between transcriptomic datasets are represented by green and red lines.

