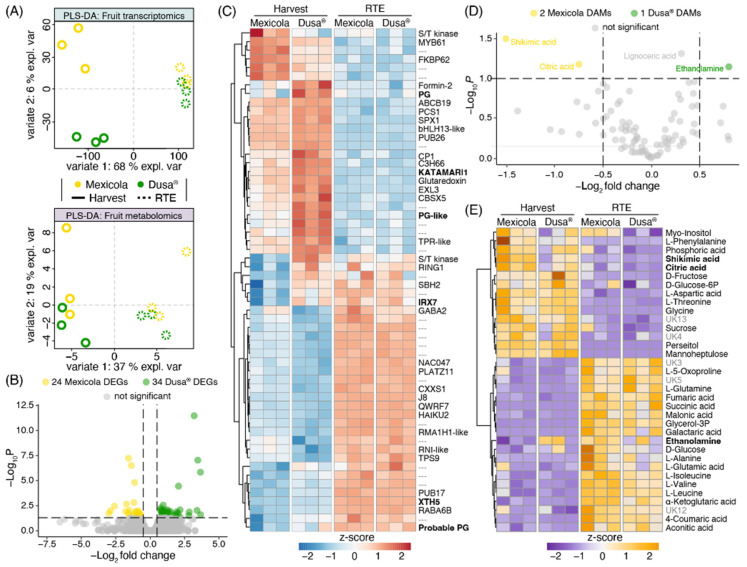
Figure 5.
Transcriptomic and metabolomic analysis comparing Hass avocado fruit grown on seedling and clonal rootstocks. (A) Partial least square discriminant analysis (PLS-DA) for fruit transcriptomics (upper side) and fruit metabolomics (lower side). (B) Differentially expressed genes at the harvest stage are represented in a volcano plot. (C) Differentially expressed genes are plotted in a red-blue color scale heatmap. Expression values were scaled considering the mean-centered divided by the standard deviation. (D) Differentially abundant metabolites at the harvest stage are represented in a volcano plot. (E) Top 35 most significant metabolites are plotted in an orange-purple color scale heatmap. Abundance values were scaled considering the mean-centered divided by the standard deviation.

