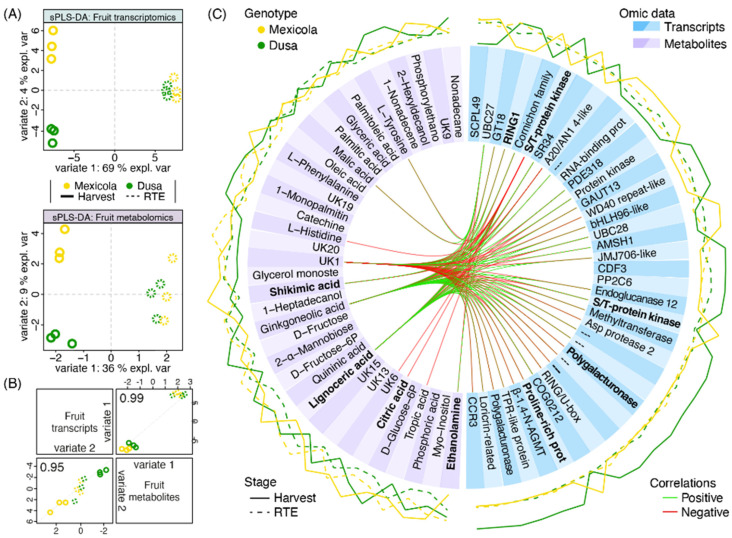
Figure 6.
Multiomics integration analysis between Hass avocado fruit grown on seedling and clonal rootstocks. (A) Sparse partial least square discriminant analysis (sPLS-DA) with the contribution of transcriptomic (upper side) and metabolomic (lower side) datasets. (B) Scatterplot from plotDiablo displaying the first (upper diagonal) and second (lower diagonal) variates with Pearson correlations between omics datasets. Numbers close to 1.0 represent a high correlation between datasets. (C) Selected variables obtained with the sPLS-DA are plotted in a circosPlot. Transcriptomic and metabolomic datasets are characterized by blue and purple boxes, respectively. Bold metabolite/gene names represent candidate variables identified by both single- and multiomics analyses.

