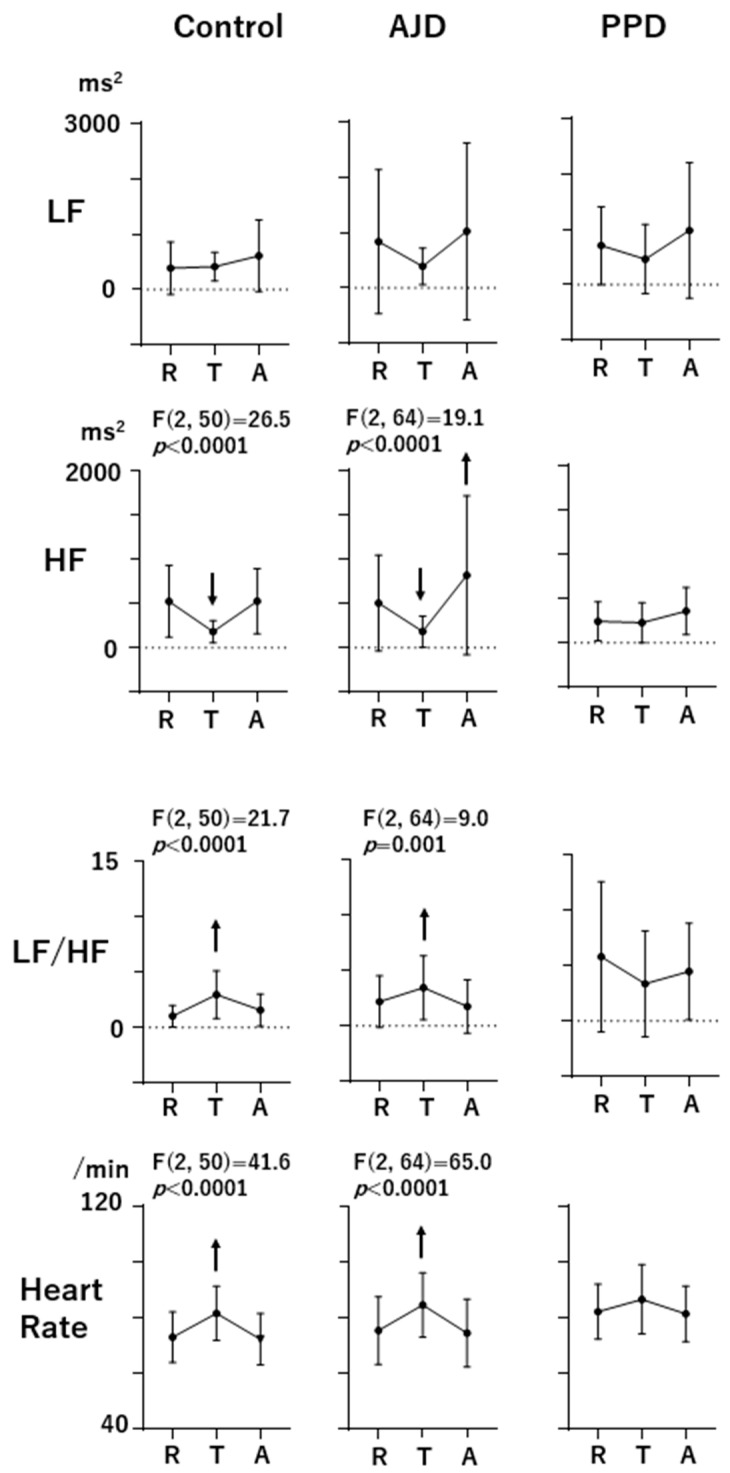
Figure 1.
The profiles of LF, HF, LF/HF, and heart rate during the three-behavioral-state paradigm (R: Rest, T: Task, and A: After). The F and p values at the top of the profiles indicate that the effects of state (Rest, Task, and After) are significant according to the repeated-measures ANOVA (p < 0.05). Upward and downward arrows indicate increment or decrement from the Rest scores, respectively (post hoc Tukey’s multiple comparison test; p values are presented in the text).

