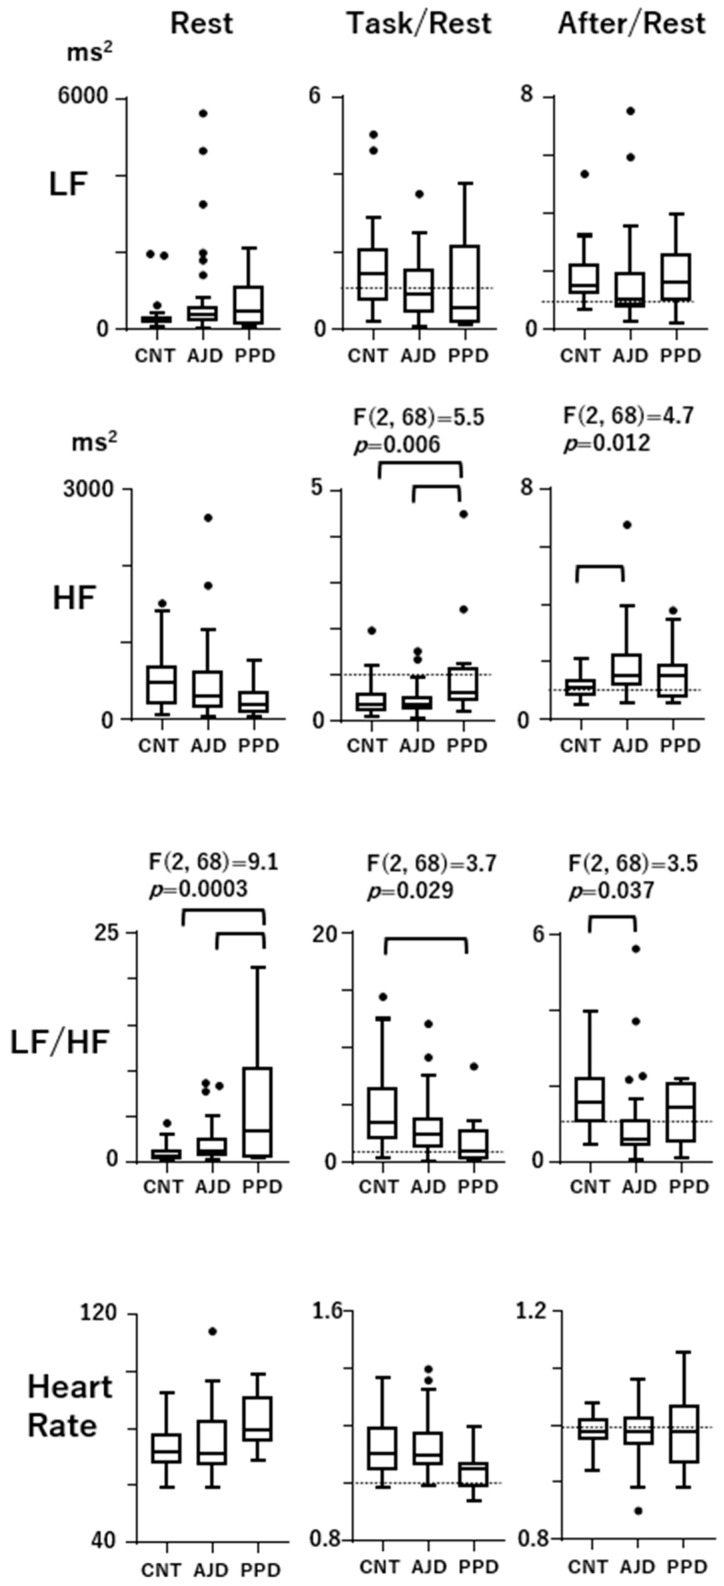
Figure 2.
Comparison of the Rest scores as well as the Task/Rest and After/Rest scores among the control, AJD, and PPD patients. The data are presented in box/whisker plots with Tukey’s format. The outliers are shown as black dots. The F and p values at the top of the profiles indicate that the effects of group (control, PPD, AJD) are significant according to the ANOVA test (p < 0.05). Statistical differences found in the post hoc Tukey’s multiple comparison test are designated by line connections (p values are presented in the text). The dashed lines in the Task/Rest and After/Rest figures designate a score of 1, indicating the Rest level.

