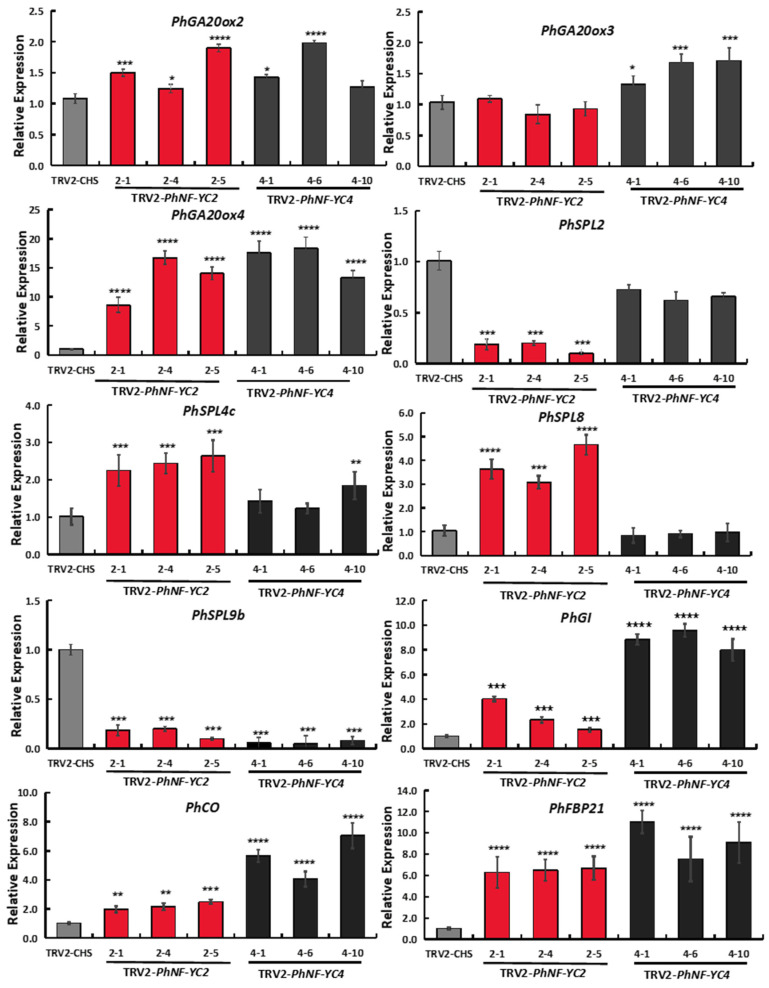
Figure 6.
Transcript abundances of flowering-related genes in PhNF-YC2-silenced and PhNF-YC4-silenced plants. Three independent experiments were performed, and error bars indicate standard deviation values. *, **, *** and **** indicate significant differences from the relative expression of control plants (TRV-CHS) at p-values < 0.05, 0.01, 0.001, and 0.0001, respectively.

