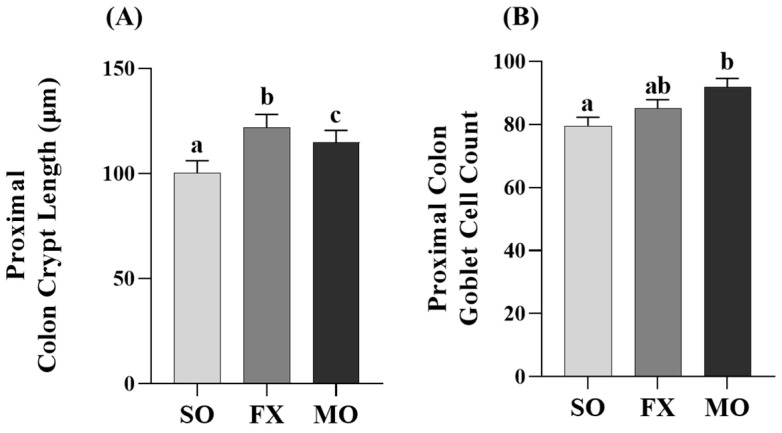
Figure 6.
Proximal colon histomorphology. Bars represent means ± SEM. Crypt length (A) and goblet cell counts (B). Data were analyzed with one-way ANOVA followed by Tukey’s multiple comparison test (n = 12/dietary group for crypt length measurements and n = 10/dietary group for goblet cell analyses). Bars not sharing a lowercase letter differ (p ≤ 0.05).

