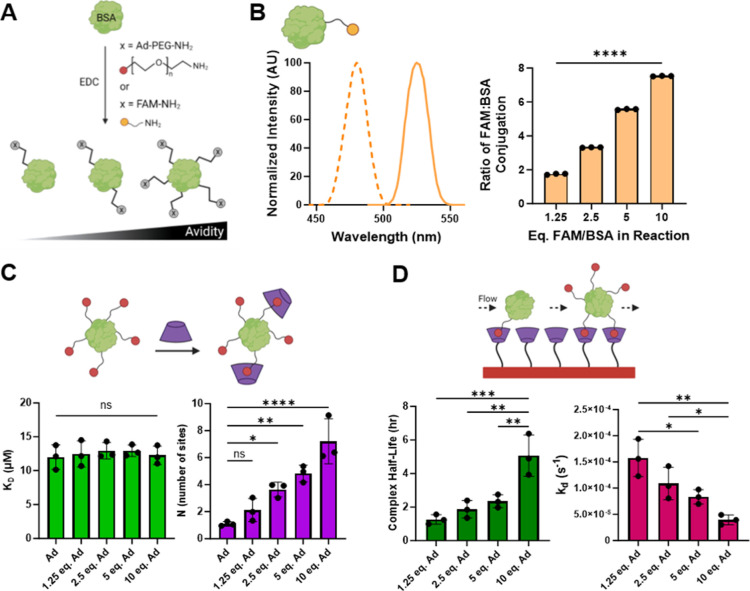
Figure 3.
Chemical modification of BSA. (A) Schematic of BSA modification with FAM and/or Ad–PEG–amine via EDC-catalyzed amidation. (B) FAM–BSA excitation and emission scans (λmax ex/em = 480/525 nm, left). Dependence of the FAM-per-BSA modification ratio on the molar feed ratio of FAM to BSA (right). Differences between all reaction conditions were highly significant, ****P < 0.0001. (C) The affinity-based thermodynamic dissociation constant of individual GH interactions (KD, bottom left) and extent of Ad–BSA modification (N, bottom right), determined by ITC (see Figures S5 and S6). (D) Avidity-controlled Ad–BSA complex half-life (bottom left) and dissociation rate constant (bottom right), determined by SPR. Data represent mean ± SD; n = 3; ns = not significant, *P < 0.05, **P < 0.01, ***P < 0.001, ****P < 0.0001; ANOVA, Tukey HSD.

