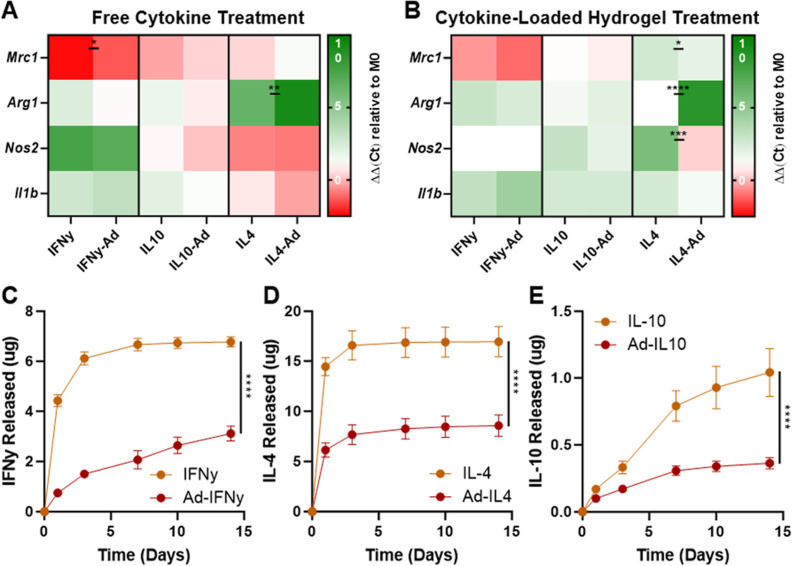
Figure 5.
Cytokine functionality and release profile. Heat maps of gene expression levels in bone marrow-derived macrophages (BMDMs) after treatment with modified and unmodified cytokines (A) or final hydrogels at the end of 14 day release (B). Data represent mean ± SD; n ≥ 1; ns = not significant, *P < 0.05, **P < 0.01, ***P < 0.001, ****P < 0.0001; two-way ANOVA, Fisher LSD. Cytokine release profiles of unmodified and Ad-modified (5 equiv) IL-10 (C), IFNγ (D), and IL-4 (E) from DexMA + MeCD hydrogels into media. Data represent the mean ± SD; n ≥ 3; ****P < 0.0001; RM two-way ANOVA.

