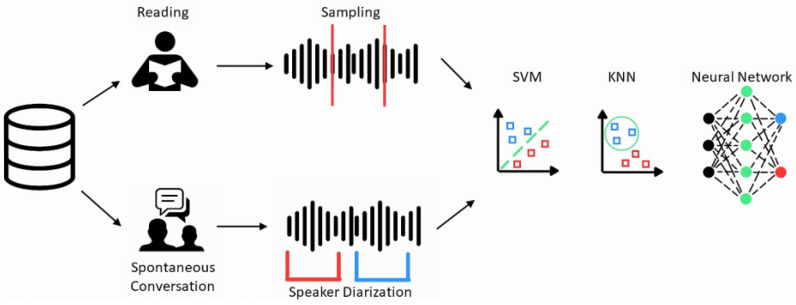
Figure 1.
Processing pipeline of the analyses performed in the study. Recordings from both tasks were classified through all three ML models represented. Concerning the representation of the ML algorithms, the blue and red squares in the SVM and KNN representation are indicative of the two different groups. Regarding the Neural Network, the black circles are the first layer of the machinery, the green circles represent the inner layers, whereas the red and blue circles are indicative of the two groups provided as output by the model.

