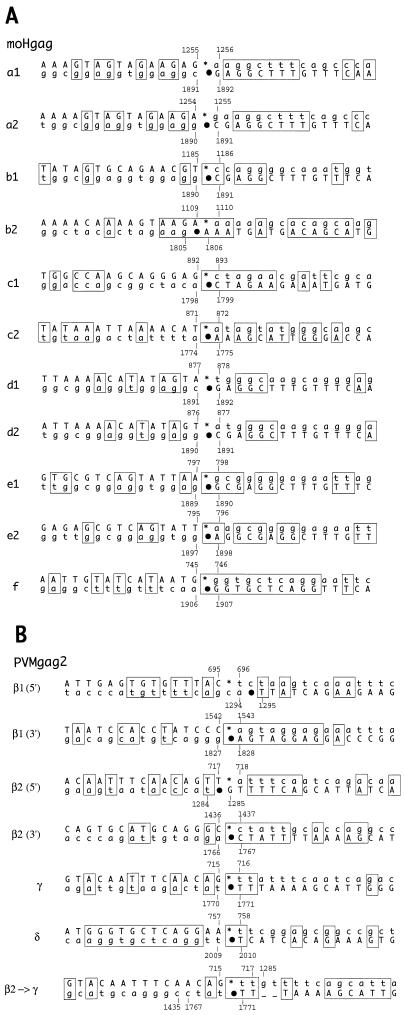
FIG. 9.
Sequence alignments of the regions surrounding the deletion borders in moHgag (A) and PVMgag2 (B) variants. Thirty nucleotides around the 5′ and 3′ borders of each deletion (15 nt upstream and downstream) were aligned and analyzed for homologies. The upper sequence shows the 5′ border, and the lower sequence shows the 3′ border, with asterisks and dots indicating the respective deletion endpoints (see also Fig. 8 for positions of these marks). Note that both sequences are positive sense and can be located either on the same template strand or on two sibling strands. Numerals refer to positions within the full-length cDNA clones, pmoHgag and pT7PVMgag2. Capital letters represent the sequence of the variant (upper left to lower right) as determined by sequencing; lowercase letters show deleted parental sequences. Sequence homologies are boxed.

