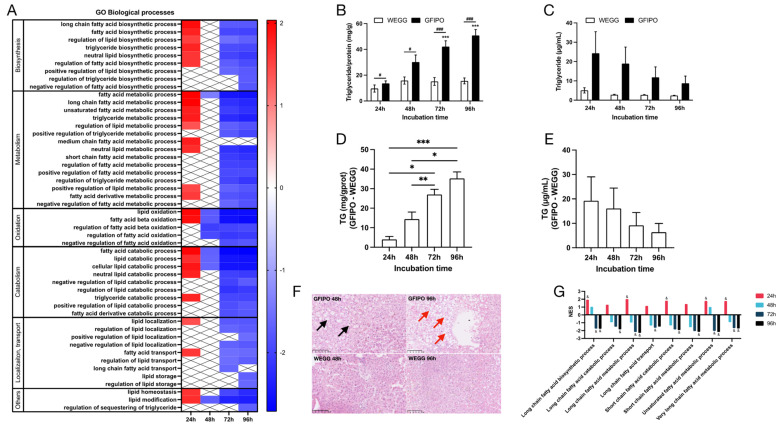
Figure 5.
Fatty acid metabolism pathways by GFIPO compared to WEGG as identified by Gene Set Enrichment Analysis (GSEA) and phenotype of triglyceride regulation. (A) Altered biological processes associated with lipid, fatty acid, and TG metabolisms (nominal p. value < 0.01) at each time point, ranked by the normalized enrichment score (NES) value on the scale bar (NES > 0, up-regulated; NES < 0, down-regulated). (B,C) Increase in TG content relative to control at 0 h in PCLSs (B) or medium (C) after up to 96 h incubation in WEGG or GFIPO. D-E Differences in TG increase between GFIPO and WEGG in PCLSs (D) and medium (E). (F) Representative images of H&E staining on PCLSs (scale bar = 100 µM, black arrows indicate microvesicular steatosis, red arrows indicate macrovesicular steatosis). (G) Altered GO biological processes by GFIPO compared to WEGG in fatty acid with different chain lengths (& indicates significantly changed compared to the corresponding WEGG). Data are presented as mean ± SEM. (#) denotes statistical differences between GFIPO and WEGG at each time point, while (*) denotes statistical differences in GFIPO or WEGG compared to their corresponding 24 h; *(#) p < 0.05, ** p < 0.01, ***(###) p < 0.001.

