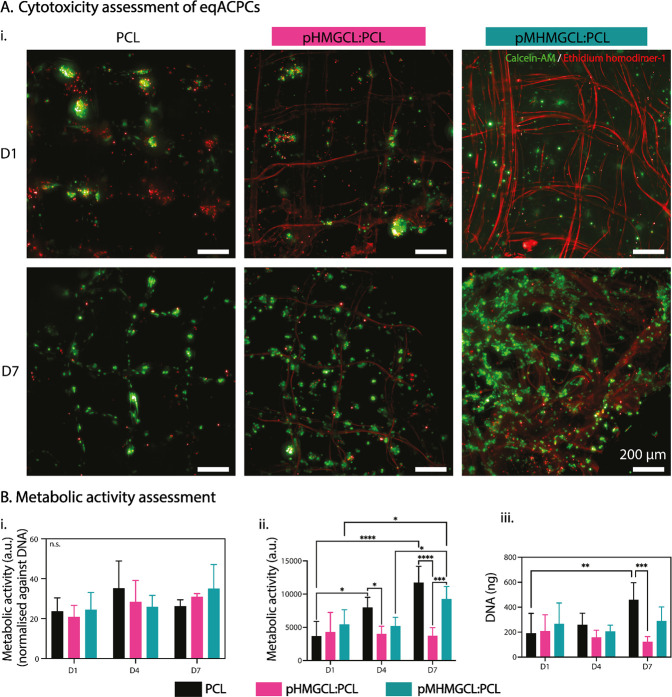
Figure 5.
Cell-viability assessment of eqACPCs cultured directly on MEW scaffolds in expansion medium. (A) Live (green)/dead (red) viability assay maximum projection fluorescent microscopy images on D1 and D7. N.B. Background staining of MEW fibers is observable in these images, likely due to the physisorption of the less hydrophobic surfaces. n = 2; scale bar = 200 μm. (B) Metabolic activity assessment of constructs on D1, D4, and D7. n = 4, data shown as the mean ± standard deviation. Significance values: n.s. p > 0.05, *p ≤ 0.05, **p ≤ 0.01, ***p ≤ 0.001, ****p ≤ 0.0001. (i) Metabolic activity quantification normalized against DNA content of sample. Separate assay results are displayed as ii. Metabolic assay, and as iii. DNA quantification.

