Figure 1.
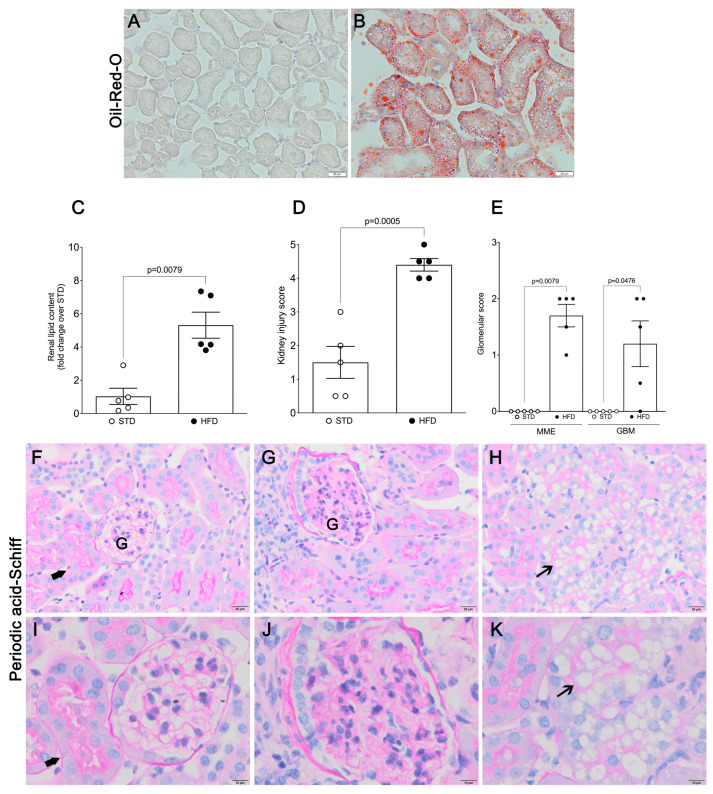
Histological assessment of tubular and glomerular changes upon HFD feeding. Representative photomicrographs of Oil Red O (A,B) and periodic acid-Schiff staining (PAS) (F–K) of frozen (A,B) and paraffin-embedded (F–K) kidney sections from mice fed an STD (A,F,I) and an HFD (B,G,H,J,K). Thick arrows, healthy renal tubule; thin arrows, vacuolization of tubular cells; (A,B,F–H) scale bar represents 20 μm, (I–K) scale bar represents 10 μm. (C) Quantification of renal lipid content (Oil Red O). (D) Kidney injury score. (E) Histopathological assessment of glomerular parameters. Data present the mean ± SEM of 5 mice/group. Three tissue sections per animal were analyzed. MME, mesangial matrix expansion; GBM, glomerular basement membrane thickness; G: Glomerulus.

