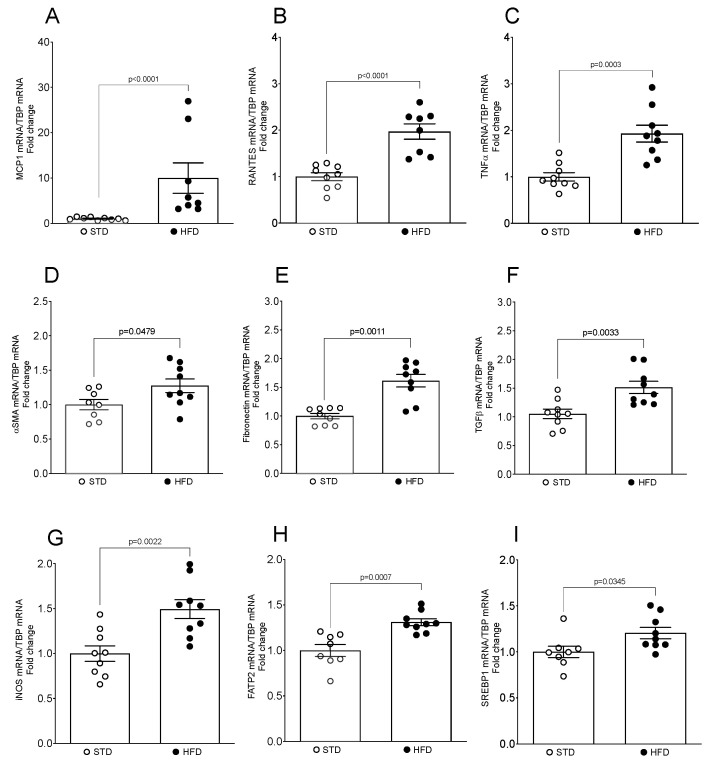
Figure 2.
Expression levels of obesity-related genes and inflammatory and profibrotic markers in the mouse kidney upon HFD feeding. (A–I) Total mRNA was isolated from kidneys and mRNA levels for specific genes were assessed by real-time qPCR. The relative mRNA levels were calculated and expressed as fold change over STD (value = 1.0) after normalizing for TBP. Data are presented as mean ± SEM (n = 8–9 mice/group).

