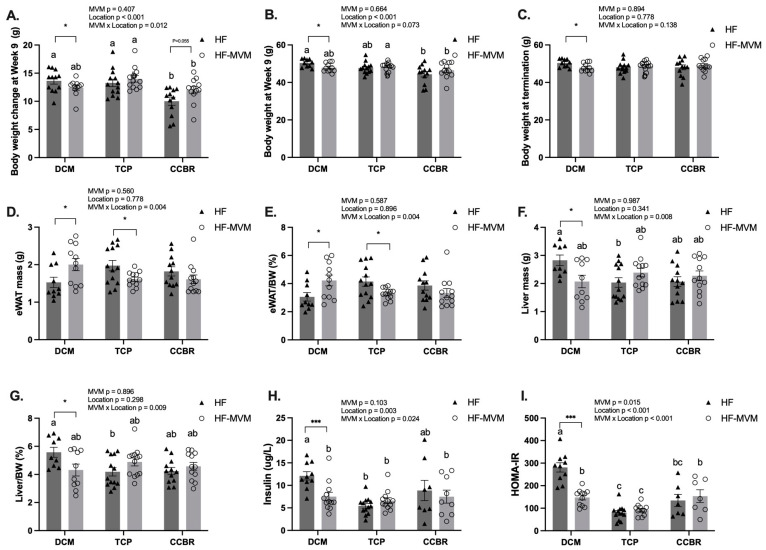
Figure 1.
Phenotypical measures in three experiments. Body weight change at Week 9 (A), body weight at Week 9 (B) and at termination in each study (C), eWAT mass (D) and percentage to body weight (E), liver mass (F) and percentage to body weight (G), fasting insulin levels (H) and HOMA-IR (I) across the three studies. Values are Mean ± SEM, n = 9–12 for DCM and CCBR, and 12–15 in TCP. A two-way ANOVA was conducted with Location (DCM, TCP, and CCBR) and MVM (HF or HF-MVM) as main factors and an MVM × Location interaction term. A Tukey’s post hoc analysis adjusted for multiple comparisons followed all significant interactions. abc Significantly different at p < 0.05 using Tukey’s post hoc analysis. A t-test was used to compare HF and HF-MVM within each location. Significant differences (p < 0.05) are indicated by an asterisk (*). * p < 0.05, *** p < 0.001.

