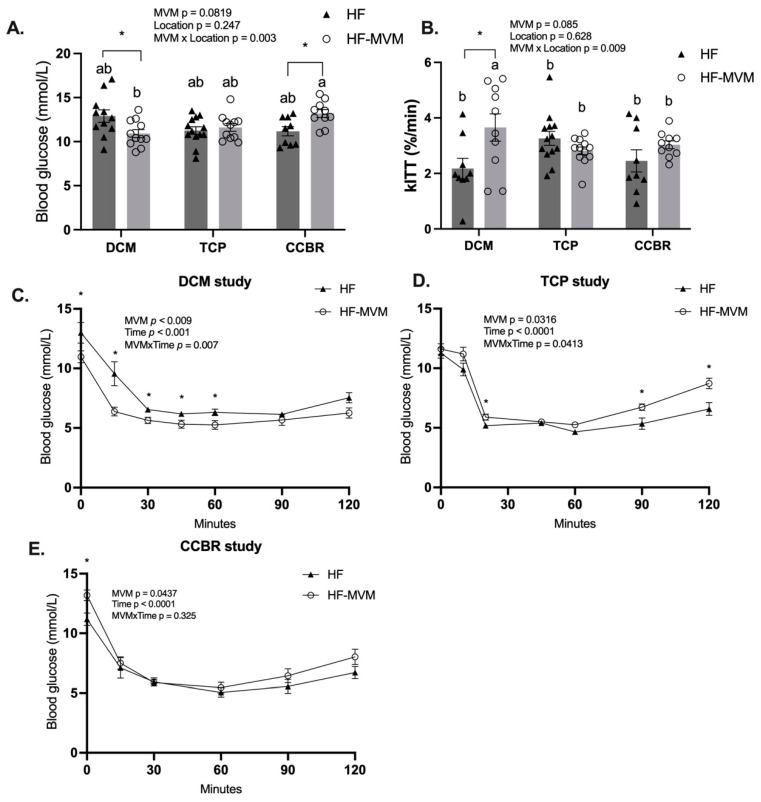
Figure 3.
Insulin tolerance test. The fasting glucose level before insulin injection across three experiments (A); the glucose disappearance rate (kITT) from 0–15 min for DCM and CCBR, and 0–20 min after insulin injection across the three experiments (B); glucose levels after intraperitoneal injection of insulin from 0 to 120 min in DCM (C), TCP (D), and CCBR (E). Values are Mean ± SEM, n = 9–12 for DCM and CCBR, and n = 12–15 in TCP. A two-way analysis of variance (ANOVA) was conducted by PROC MIXED procedure with MVM (non-MVM vs. MVM) and time as main factors and an MVM*Time interaction term followed by Tukey’s post hoc test on ITT. A two-way ANOVA was conducted with dietary MVM and Location as main factors and an MVM × Location interaction term on fasting glucose and kITT by Tukey’s post hoc test. ab Significantly different at p < 0.05. * p < 0.05.

