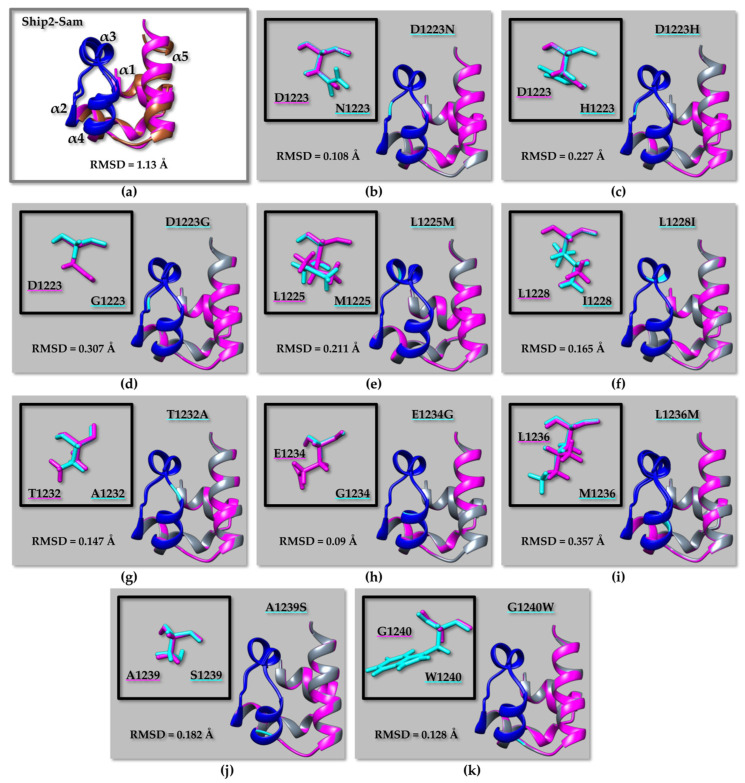
Figure 5.
(a) Superimposition on the backbone atoms of Ship2–Sam NMR structure (first conformer, pdb entry 2K4P [17] without the flexible N-tail, residue range G1200–K1258) (brown) and corresponding AF2 [24,58] model (magenta). (b–k) Overlays on the backbone atoms of AF2 models of Ship2–Sam (magenta) and cancer-related mutants (grey): (b) D1223N, (c) D1223H, (d) D1223G, (e) L1225M, (f) L1228I, (g) T1232A, (h) E1234G, (i) L1236M, (j) A1239S, (k) G1240W. Only mutations in or close to the ML interface are shown. The ML interface (residues H1239–E1238) is coloured in blue in all panels. The backbone of mutated residues is coloured in cyan, whereas side chains of native and mutated amino acids are shown in magenta and cyan, respectively, in the upper left inserts. RMSD values are indicated in each panel.

