Figure 7.
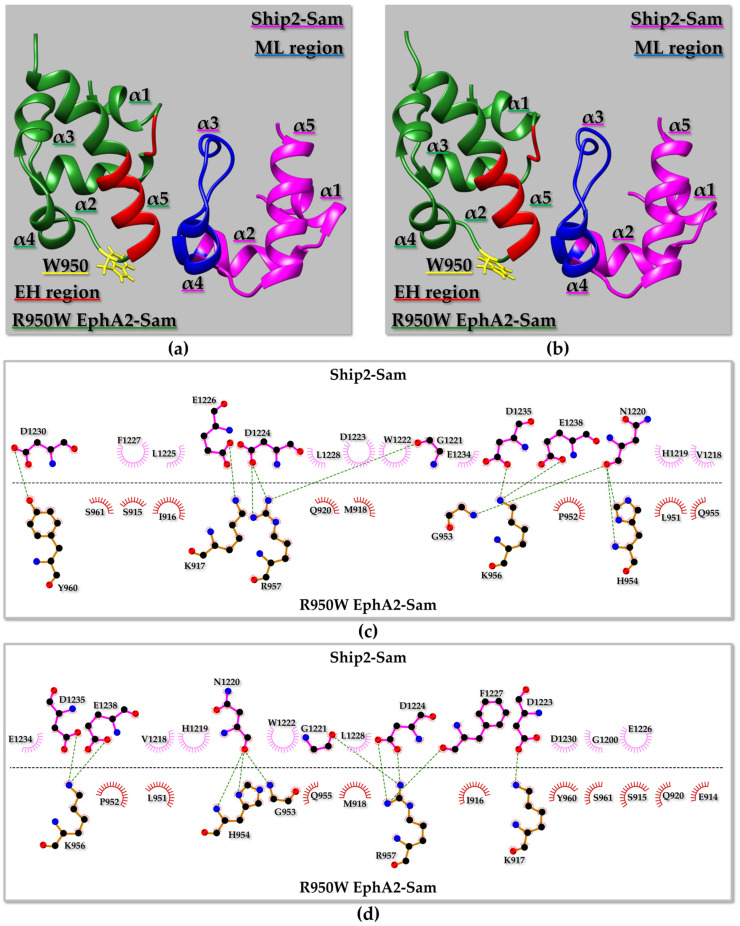
(a,b) Ribbon representation of the R950W EphA2–Sam/Ship2–Sam complex: the best structure from the best Haddock [34] cluster is shown in (a), whereas the best structure from the most populated cluster is shown in (b). The mutated residue is highlighted in yellow, and its side chain is shown as well; the EH and ML interaction interfaces in R950W EphA2–Sam, and Ship2–Sam are coloured in red and blue, respectively. (c) 2D diagram of intermolecular interactions generated by LigPlot+ [71,72] analysis of the binding interface in the R950W EphA2–Sam/Ship2–Sam complex shown in panel (a). (d) 2D diagram of intermolecular contacts identified by LigPlot+ [71,72] for the R950W EphA2–Sam/Ship2–Sam complex shown in panel (b). (c,d) Carbon, Nitrogen, and Oxygen atoms are indicated by black, blue, and red spheres, respectively. H-bonds are highlighted with green dashed lines. R950W EphA2–Sam and Ship2–Sam residues involved in non-bonded interactions are labeled and represented by red and pink crescents with bristles.

