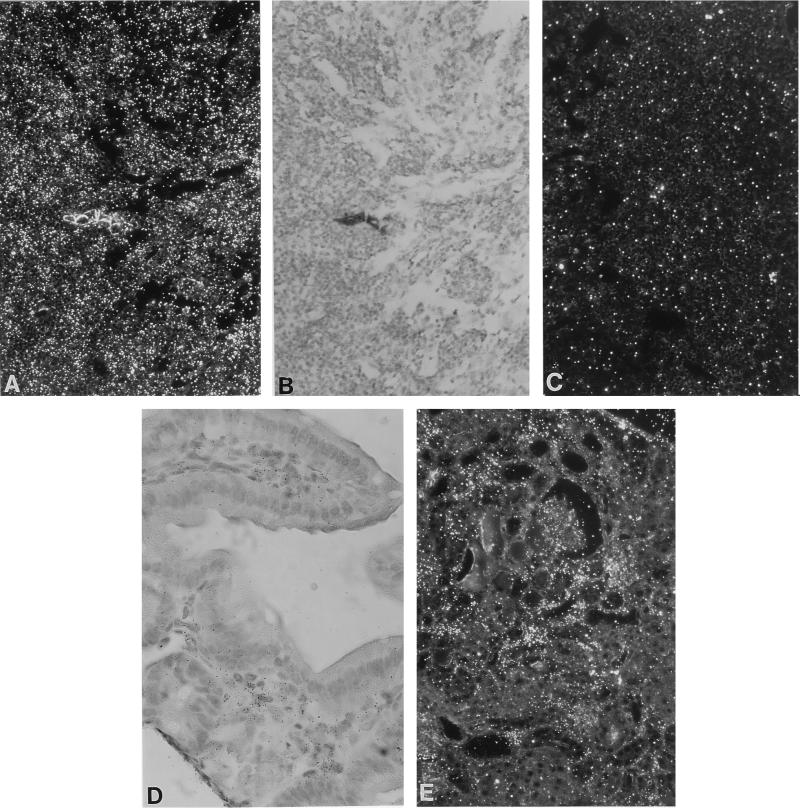
FIG. 6.
Elevated levels of RANTES expression in CD4C/HIVWT Tg mice. Assessment was done by ISH. (A to C) Lymph node (F17018). Dark-field (A) and bright-field (B) images of the same field show tissue hybridized with the antisense probe. (C) Hybridization with the control sense probe. Note the hypocellularity of the node in panel B. (D and E) ISH-positive cells of the lamina propria of the intestine (F17001) (D) and in interstitial cells in the kidney (F17001) (E). Magnifications, ×180 (A to C and E) and ×380 (D). The counterstain was hematoxylin and eosin.

