
Figure 2. Community dynamics of PedsCom consortium is restricted during weaning.
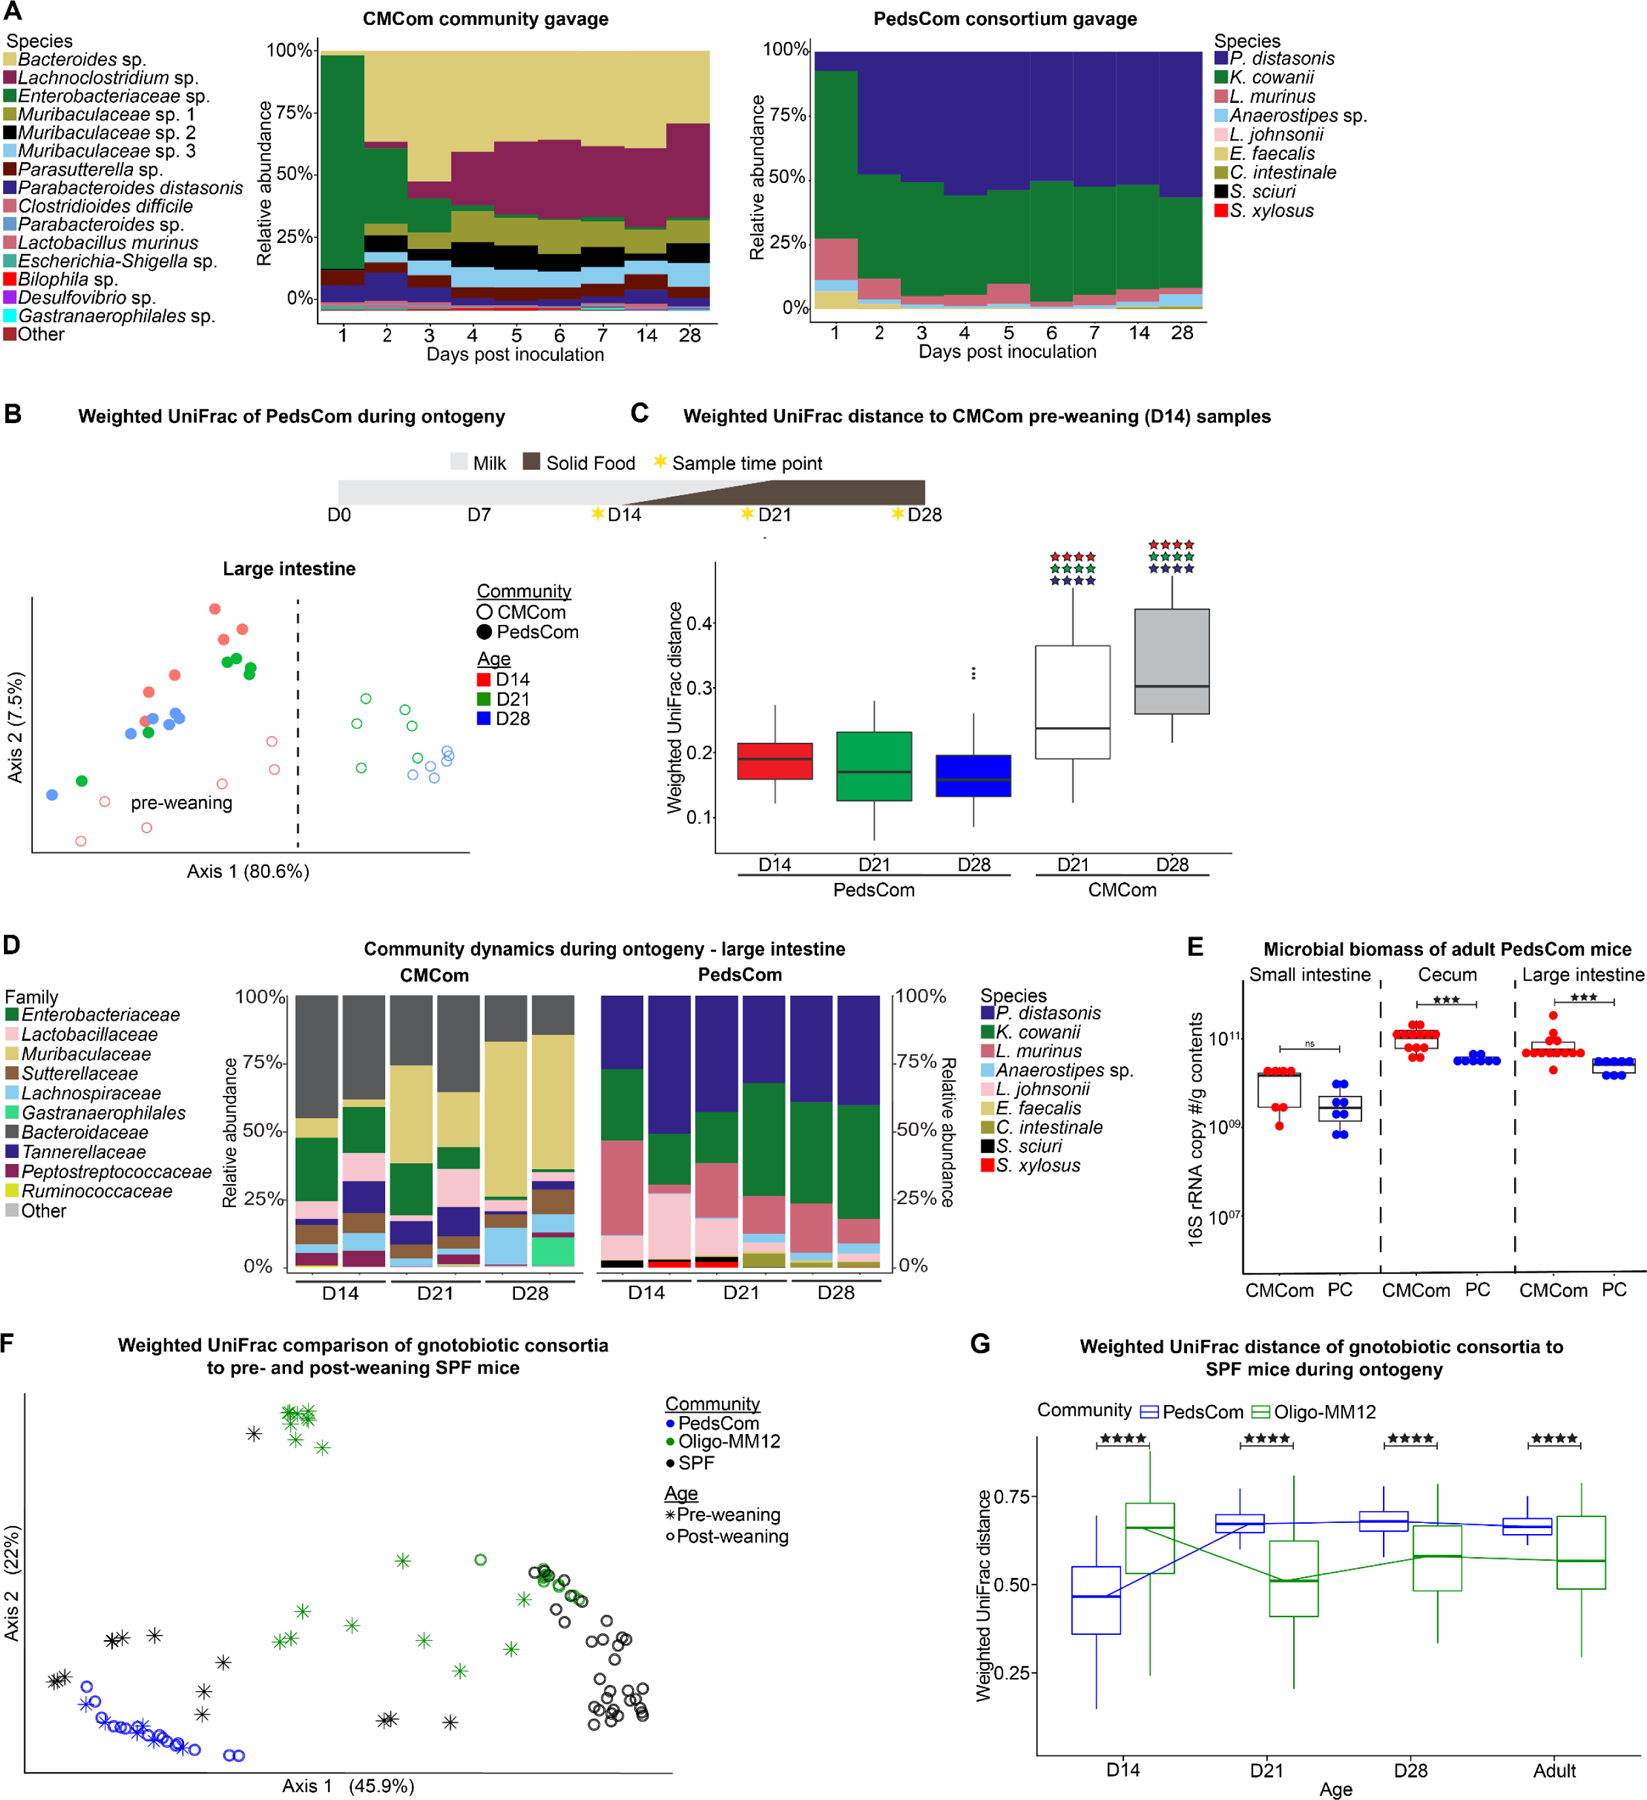
A. Representative species level fecal microbiota of ex-germfree female C57BL/6J mice gavaged with PedsCom consortium (N = 6 mice, 2 independent experiments) or CMCom community (N = 3 mice). B. Weighted UniFrac Principal Coordinates Analysis (PCoA) of the large intestine microbiota of PedsCom and CMCom mice at 14, 21 and 28 days old. Dashed line highlights separation of CMCom pre-weaning and post-weaning samples. N = 6 samples per timepoint. C. Median weighted UniFrac distance comparison of day 14 CMCom large intestine microbiota (pre-weaning) to all PedsCom and post-weaning (D21, D28) CMCom microbiota. Color of stars indicates PedsCom timepoint compared (D14 = red, D21 = green, D28 = blue). N = 6 samples per timepoint. Data represented with box and whisker plot. Mann-Whitney-Wilcoxon test ****p<0.0001. D. Species and family level 16S rRNA gene relative abundance of microbiota from PedsCom and CMCom mice during ontogeny in the large intestine. Two representative litters for each community and timepoint. E. Intestinal biomass of adult CMCom and PedsCom mice (16S rRNA gene copies per gram intestinal contents; PedsCom - N = 8 per tissue, CMCom – S.I. N = 7, Cecum and L.I, N = 13). F. Weighted UniFrac PCoA of the large intestine microbiota of pre- and post-weaning SPF sv129 mice from vivarium 2 (N = 42) to PedsCom (N = 22) and Oligo-MM12 (N = 51). G. Median weighted UniFrac distance of pre-weaning (day 14) and post-weaning (≥ day 21) SPF vivarium 2 mice to all PedsCom and Oligo-MM12 timepoints. Data presented with box and whisker plot. Mann-Whitney-Wilcoxon test **p<0.01, ***p<0.001. See also Figure S2–3.