. 2024 Feb 1;15(11):4019–4030. doi: 10.1039/d3sc06222h

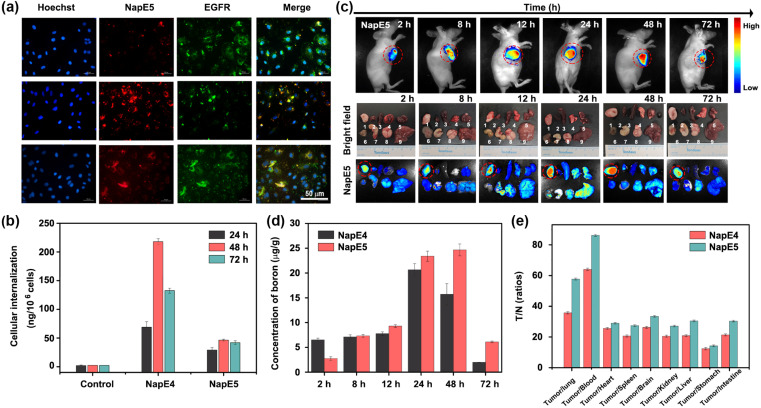
Fig. 4. (a) Confocal microscopy images of A549 cells incubated with NapE5 (60 μM), Hoechst and EGFR (24 h, 48 h, 72 h; NapE5, λex = 559 nm and λem = 600–720 nm; EGFR, λex = 488 nm and λem = 500–600 nm; Hoechst: λex = 405 nm and λem = 400–500 nm), scale bar = 50 μm. (b) The boron content of A549 cells incubated with NapE4-5 (60 μM). (c) Fluorescence images of A549 tumor-bearing mice and organs at different times after intravenous injection of 15 mg kg−1 of NapE5. 1: tumor; 2: heart; 3: spleen; 4: lung; 5: kidney; 6: intestine; 7: stomach; 8: brain; 9: liver (NapE5: λex = 455 nm and λem = 580–750 nm). (d) The boron content of NapE4-5 internalized in the A549 tumor-bearing mice at different times. (e) The T/N ratio of the boron content of different organs from A549 tumor-bearing mice at 24 h for NapE4-5.

Fig. 4