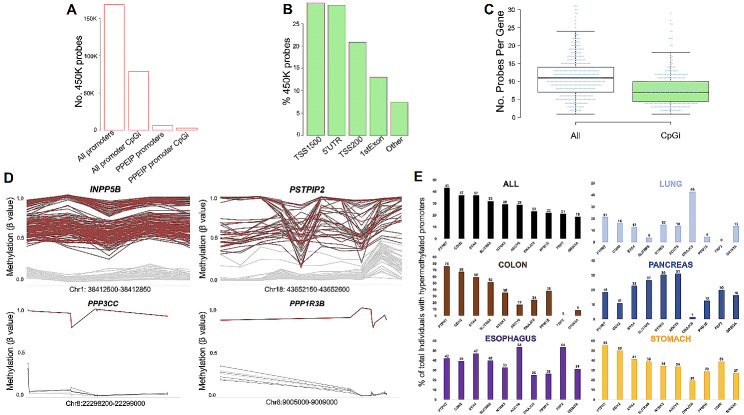
Fig. 1.
Infinium Human Methylation 450K BeadChip (450K) probe distribution and promoter hyper-methylation analysis reveals cancer-associated epimutations occur with varying frequencies in multiple tissues. A. Distribution of 450K probes across all gene promoters (and CpG island-specific) and PPEIP promoters (also showing CpG island specific probes). B. % of promoter CpG genomic annotations. TSS1500 = CpG present within 1500 bp from transcription start site (TSS), TSS200 = within 200 bp of TSS, 5’UTR = CpG is found within the 5’ untranslated region of the PPEIP and 1stExon = CpG found in the first exon of the PPEIP gene. The annotation “others” refers to promoter CpG’s that annotate to other genomic regions (such as gene bodies or introns) of overlapping genes. C. Distribution of promoter probes per gene annotated to both CpG islands and non-CpG islands. D. Examples of hyper-methylated PPEIP promoters for both recurrent (observed in > 5% of the cancer population) and rare (< 1% % of the cancer population) epimutations. Red lines present individuals with outlier epimutations and grey lines, healthy controls. E. Bar graph showing the ten most epimutated PPEIP genes. Numbers on the y-axis (and above each bar) represent the % of total cancer individuals in all cancer tissues (ALL) as well as a breakdown of epimutations identified in individuals of specific cancer related tissue

