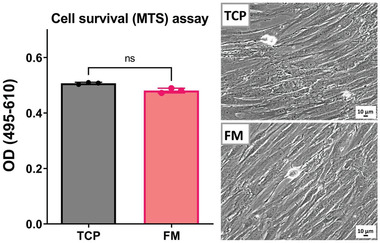
Figure 5.

Results of MTS assay for assessment of cell mitochondrial activity. The data plotted in the graph represents the effect of fungal monofilaments on cell survival compared to control (TCP). Images show the cell density of the control sample (TCP) and the sample containing fungal monofilaments (FM).
