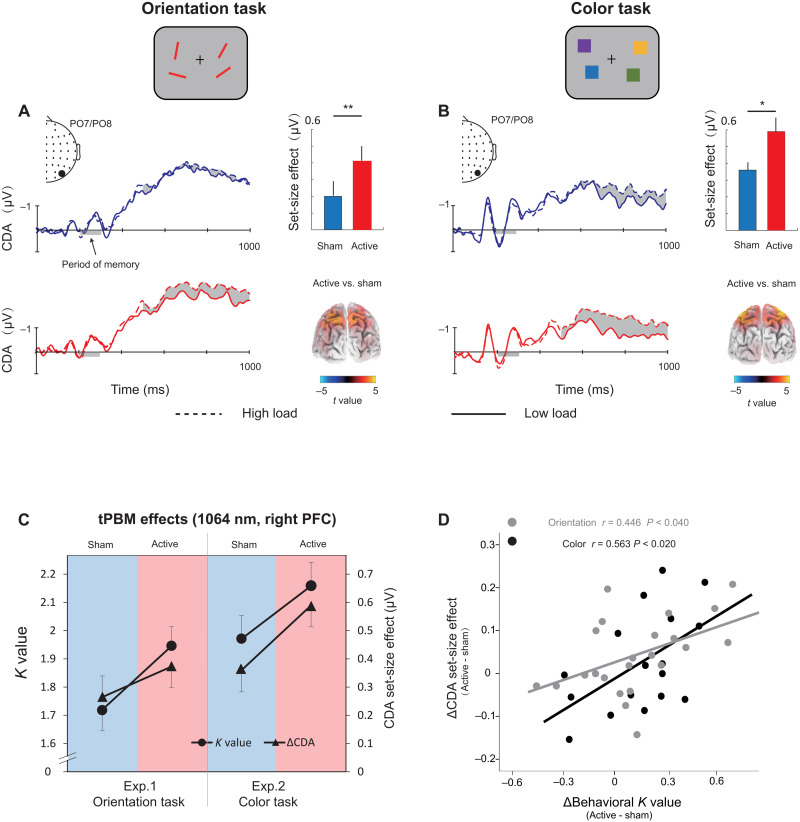
Fig. 2. Grand average of ERPs and its link with behavior.
(A) The orientation WM task in experiment 1 and (B) the color WM task in experiment 2. Shading indicates the CDA set-size effect. The enlarged black dots on EEG topographies show PO7/PO8 electrodes. Bar plots represent the average CDA set-size effect. Error bars represent SEM. Significant set-size effects are located in the IPS. Three-dimensional (3D) brain map (t-map; posterior view) of significant tPBM effect on CDA. (C) tPBM-effect. K values and CDA set-size effect for the two tasks (orientation WM task and color WM task) and two sessions (active tPBM and sham tPBM). (D) Scatterplots of participants’ behavioral benefits (active minus sham) against the changes in the CDA set-size effect (active minus sham) for the orientation WM task (gray) and the color WM task (black). *P < 0.05 and **P < 0.01.

