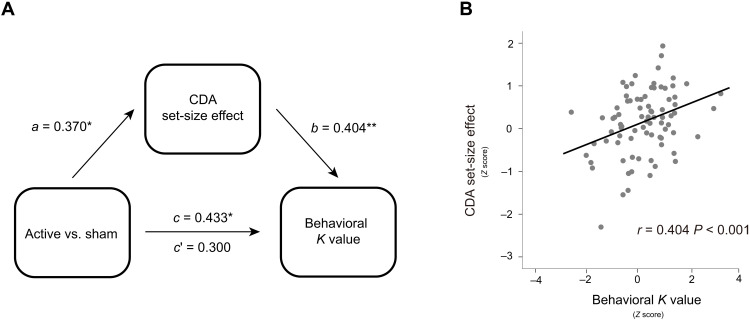
Fig. 3. The CDA set-size effect mediated behavioral K values by 1064-nm tPBM.
(A) Mediation model demonstrating the effect of 1064-nm tPBM on improved K values via increases in the CDA set-size effect. a, b, and c denote standardized beta coefficients of the direct path strength. c′ denotes the beta coefficient of path strength after controlling for changes in the CDA set-size effect. (B) Scatterplots of the behavioral K values (Z score) and the CDA set-size effect (Z sore) across all participants (active and sham session) in experiment 1 and experiment 2. *P < 0.05 and **P < 0.01.

