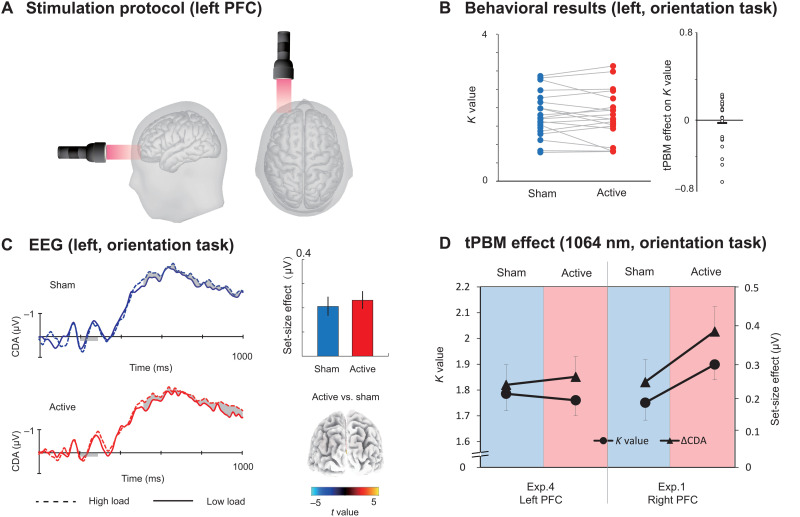
Fig. 5. Results in experiment 4.
(A) Stimulation protocol of experiment 4. Active tPBM was delivered by the laser with wavelength 1064 nm at the left PFC for a total of 12 min. (B) K values for tPBM stimulation (active and sham) were applied on the left PFC in experiment 4. Each circle indicates individual performance. (C) Grand average of ERPs for the 1064-nm and sham tPBM sessions in experiment 4. Shading indicates the CDA set-size effect. Bar plots represent the average CDA set-size effect: blue, sham session; red, active session. Error bars represent SEM, 3D brain map (t-map) posterior view of a significant tPBM effect on CDA. (D) K values and CDA set-size effect for the orientation WM task in experiment 4 (tPBM stimulation applied on the left PFC) and in experiment 1 (tPBM stimulation applied on the right PFC).

