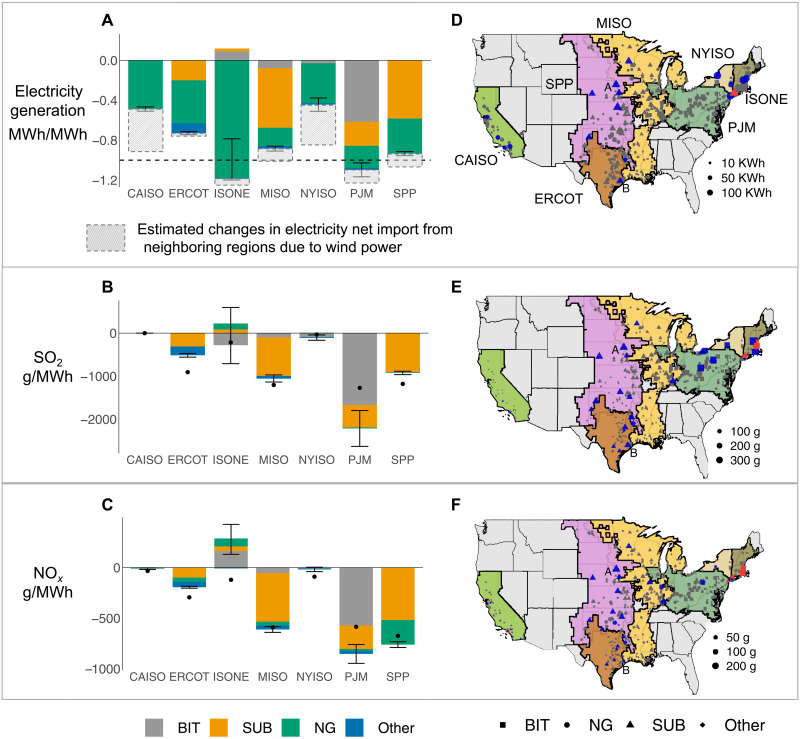
Fig. 1. Estimated changes in electricity generation, SO2, and NOx emissions from fossil fuel EGUs due to 1 MWh increase in wind power in each ISO region.
(A to C) The aggregated changes by different ISO regions. Dashed line in (A) represents the 1-MWh threshold. Dots in (B) and (C) represent the ISO-wide average emission factors during 2011 to 2017. The error bar indicates the 95% confidence interval of the aggregated estimates. EGUs are classified by their primary fuel types (BIT, bituminous coal; NG, natural gas; SUB, subbituminous coal). The shaded bars in (A) indicate the estimated changes in electricity net import from neighboring regions due to wind power. (D to F) Changes for each fossil fuel power plant. Plants in blue and red on the map are those for which generation or emission changes account for >5% of the total displacement of generation or emissions within each ISO region (plants with >10% of the total ISO impacts are colored in the ISONE and NYISO region). Blue indicates a decrease in generation or emissions due to increased wind power, and red indicates an increase. Points A and B on the maps show two power plants as illustrations (discussed in the results section “Marginal impacts of wind power on unit-level emissions and associated premature mortality”).

