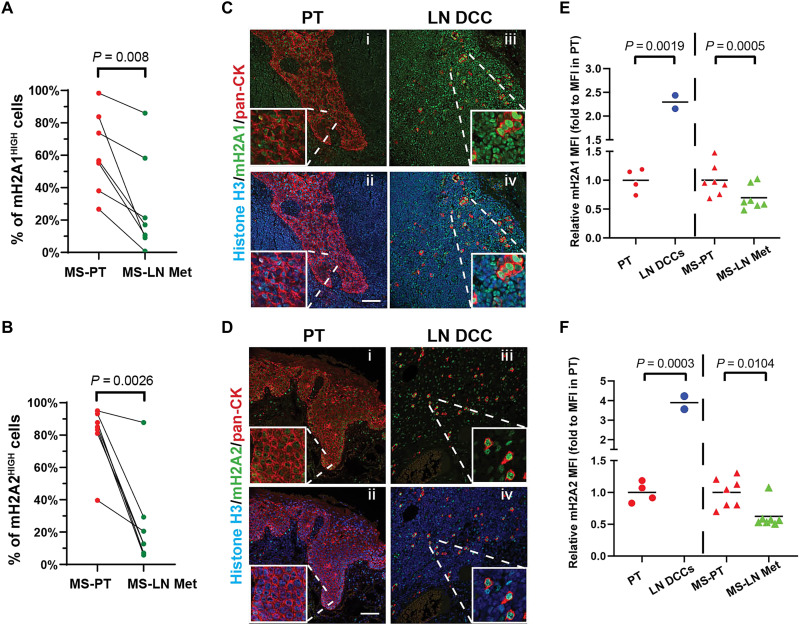
Fig. 2. MacroH2A variants are enriched in solitary DCCs versus primary tumor and metastatic lesions in patients with HNSCC.
(A and B) Quantification of the percentage of macroH2A1- or macroH2A2-high cells in either primary tumors or LN metastases. Each paired primary tumor (MS-PT) tissue section (red) and LN metastatic lesion (MS-LN Met, green) were from the same patient. See fig. S2 for the detailed quantification method and representative images. n = 7 patients; each data point represents the mean percentage of macroH2AHIGH cells pooled from five to six fields of view. Paired Student’s t test. (C and D) Representative images of IF staining in primary tumor tissues or clinically negative LN tissues. macroH2A1 (C) or macroH2A2 (D) are in green; pan-cytokeratin is in red, and Histone H3 is in blue. Scale bar, 75 μm. (E and F) Measurement of relative macroH2A1 or macroH2A2 intensity (normalized to histone H3 intensity) in HNSCC primary tumors (red dots) or DCCs (blue dots) found in clinically negative patient LN tissues after the primary tumor removal, as well as paired PT section (red triangles) and MS-LN Met (green triangles).

