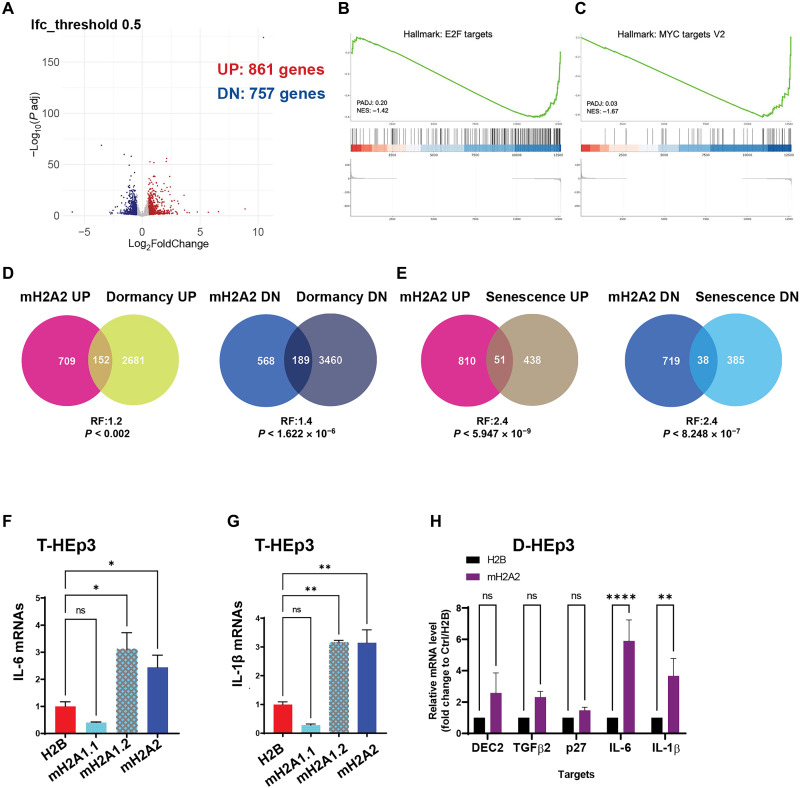
Fig. 4. MacroH2A2-induced dormancy displays features of spontaneous dormancy and senescence.
(A) Volcano plot displays the DEGs detected by RNA-seq from T-HEp3 cells with mH2A2 versus H2B overexpression. Log2 fold change cutoff is 0.5; 861 up-regulated genes, 757 down-regulated genes. (B and C) Top negatively correlated Hallmark gene sets using RNA-seq data via GSEA. (D) Venn diagrams show the comparison of up-regulated and down-regulated genes in D-HEp3 with up- and down-regulated genes in macroH2A2 overexpressing cells. (E) Venn diagrams show the comparison of up- and down-regulated genes in oncogene-induced senescent fibroblasts (IMR90) with up- and down-regulated genes in macroH2A2 overexpressing T-HEp3 cells. (F and G) qPCR analysis of IL-6 and IL-1β transcript levels in T-HEp3 cells overexpressing individual macroH2A variants. PCR in triplicate, mean + SEM. P value is analyzed via one-way ANOVA. (H) qPCR analysis of dormancy and senescence gene mRNA levels in the indicated D-HEp3 cells with mH2A2 overexpression or H2B as control. PCR in triplicate, mean + SEM.

