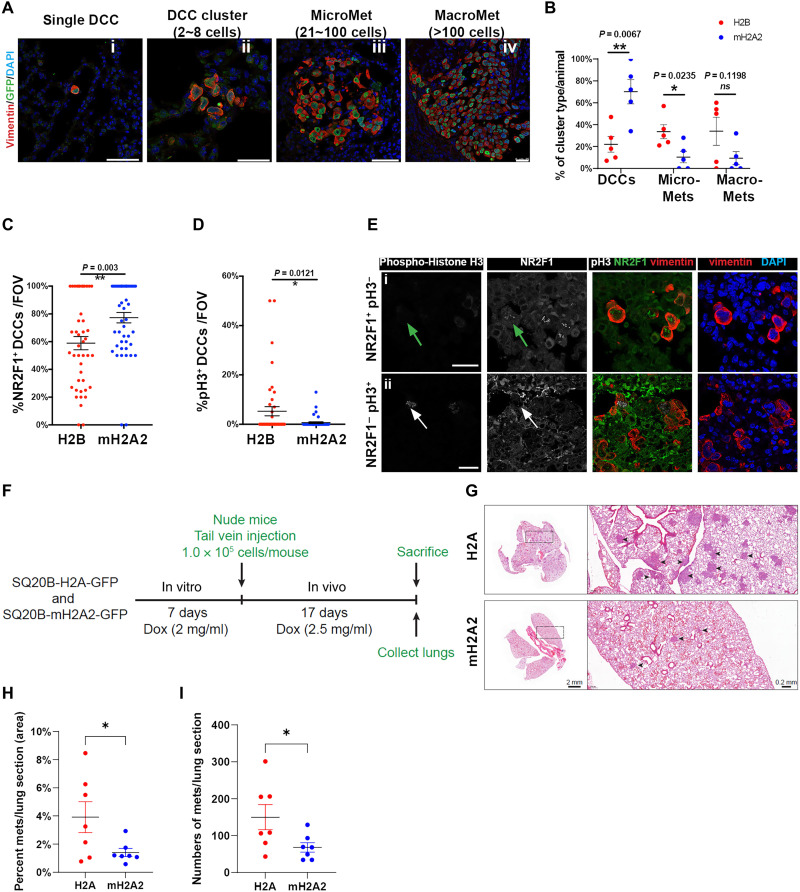
Fig. 5. MacroH2A2 overexpression promotes the accumulation of quiescent DCCs to prevent metastatic growth.
(A) Experimental metastasis assay. T-HEp3 cells with mH2A2-GFP or H2B-GFP expression were tail vein–injected in nude mice. Three weeks later, the lungs were retrieved and processed for FFPE sections. n = 5 animals per condition. Representative IF images of single DCC, DCC cluster (<8 cells), micro-Met, and macro-Met were costained with GFP, human vimentin (red), and DAPI (blue). Scale bar, 50 μm. (B) Quantification of DCC, micro-Met, and large-Met event frequency in the freshly resected lungs in each animal. Single cells and small clusters (<8 cells) are all included as DCC events. Red dots annotate control animals with H2B expression; blue dots annotate experimental animals with mH2A2 overexpression. Mean ± SEM. Two-tailed unpaired t test. (C and D) Quantification of IF staining for NR2F1, H3S10phos phorylation (pH3+), and human vimentin in DCCs found in the lungs per condition. n = 80 fields of view pooled from five animals per condition. (E) Representative IF images of NR2F1 (green), human vimentin (red), and H3S10phos (gray) in lung DCCs. Green arrow, NR2F1-positive cell; white arrow, pH3-positive cell. Scale bar, 25 μm. (F) Schematic depicting the in vivo experimental metastasis assay timeline. (G) Representative images of each group showing metastatic lesions (arrowheads) in lungs stained with H&E. (H and I) Quantification of the percentage of metastatic area (H) and number of metastatic lesions per animal (I). Mann-Whitney test was used for statistical test. n = 7 per group.

