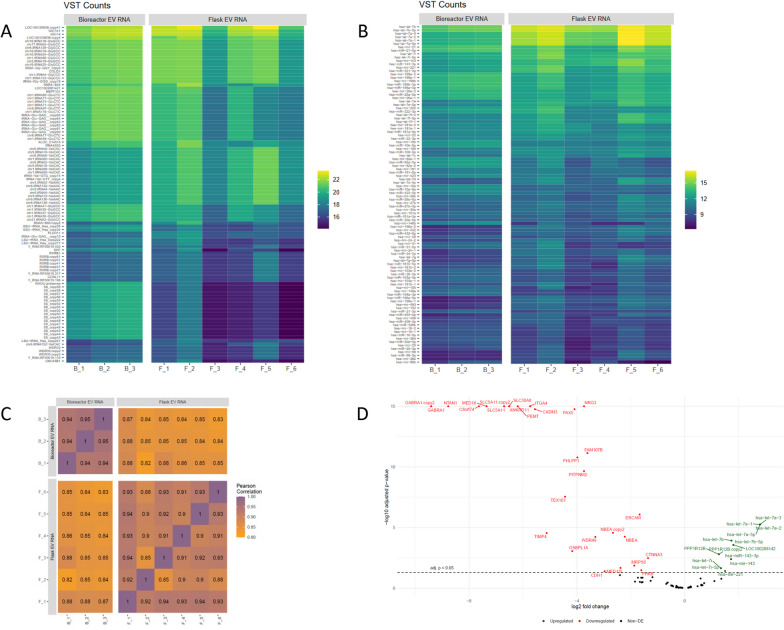
Fig. 3.
Comparison of the mi-RNA and m-RNA cargo of EVs produced by flask or bioreactor process. RNA-seq was performed on EV produced in flasks from six different MSC isolates (N = 6 biological replicates, F_1 to F_6) and in the bioreactor EVs (96H) of one MSC isolate B done in triplicate (N = 3, technical replicates B_1 to B_3). A The heatmap profile after applying variance stabilizing transformation (VST) to reduce background of the 100 most abundant messenger-RNAs and B micro-RNA in the flask and bioreactor EVs. C Correlation between the RNA-seq data sets was performed using Pearson correlation analysis, where the correlation coefficient (R) value ranges from 1.0 to 0.0, implying complete to no correlation between data sets D Volcano plot of significantly upregulated and down-regulated mi-RNA and m-RNA in flask EVs compared to bioreactor EVs

