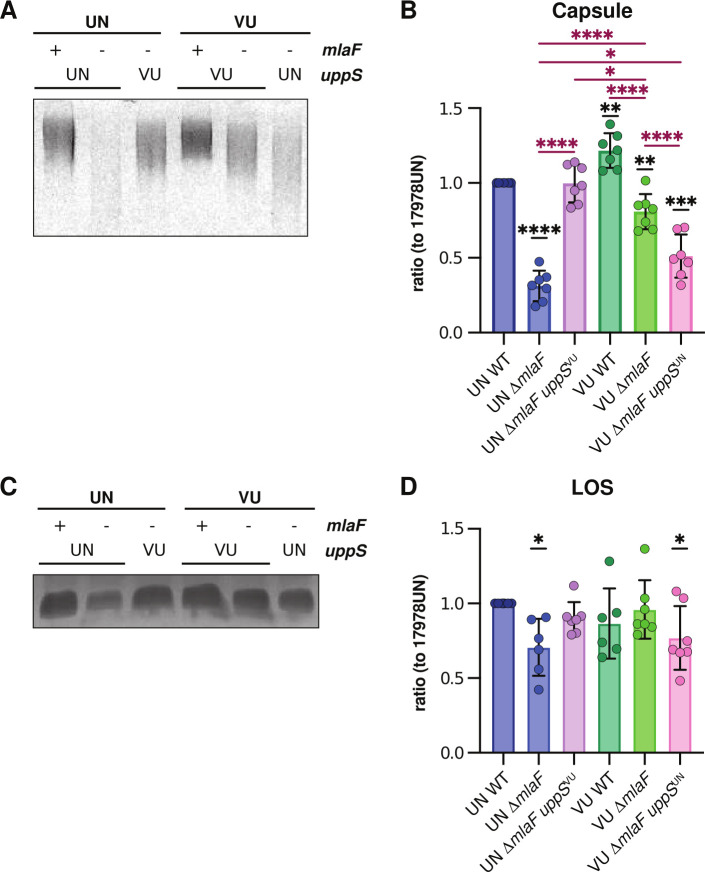
Fig 6.
UppSUN results in reduced capsule and LOS abundance. (A) Alcian blue stain of capsular polysaccharides from cell lysates. Cell lysates were normalized to total protein. Image is representative of seven biological replicates from three independent experiments. (B) Densitometric quantification of capsule bands as a ratio to 17978UN wild type. Data are means ± SEM, n = 7 from three independent experiments, significance is by one-sample t-test compared to 1 (black asterisk) and one-way ANOVA with Sidak’s multiple comparisons (maroon asterisk). *P < 0.05, **P < 0.01, ***P < 0.001, ****P < 0.0001. (C) Silver stain of proteinase K-treated cell lysates to stain for LOS. Cell lysates were normalized to total protein. Image is representative of seven biological replicates from three independent experiments. (D) Densitometric quantification of LOS bands as a ratio (to 17978UN wild type). Data are means ± SEM, n = 6–7 from three independent experiments, significance is by one-sample t-test compared to 1. *P < 0.05.

