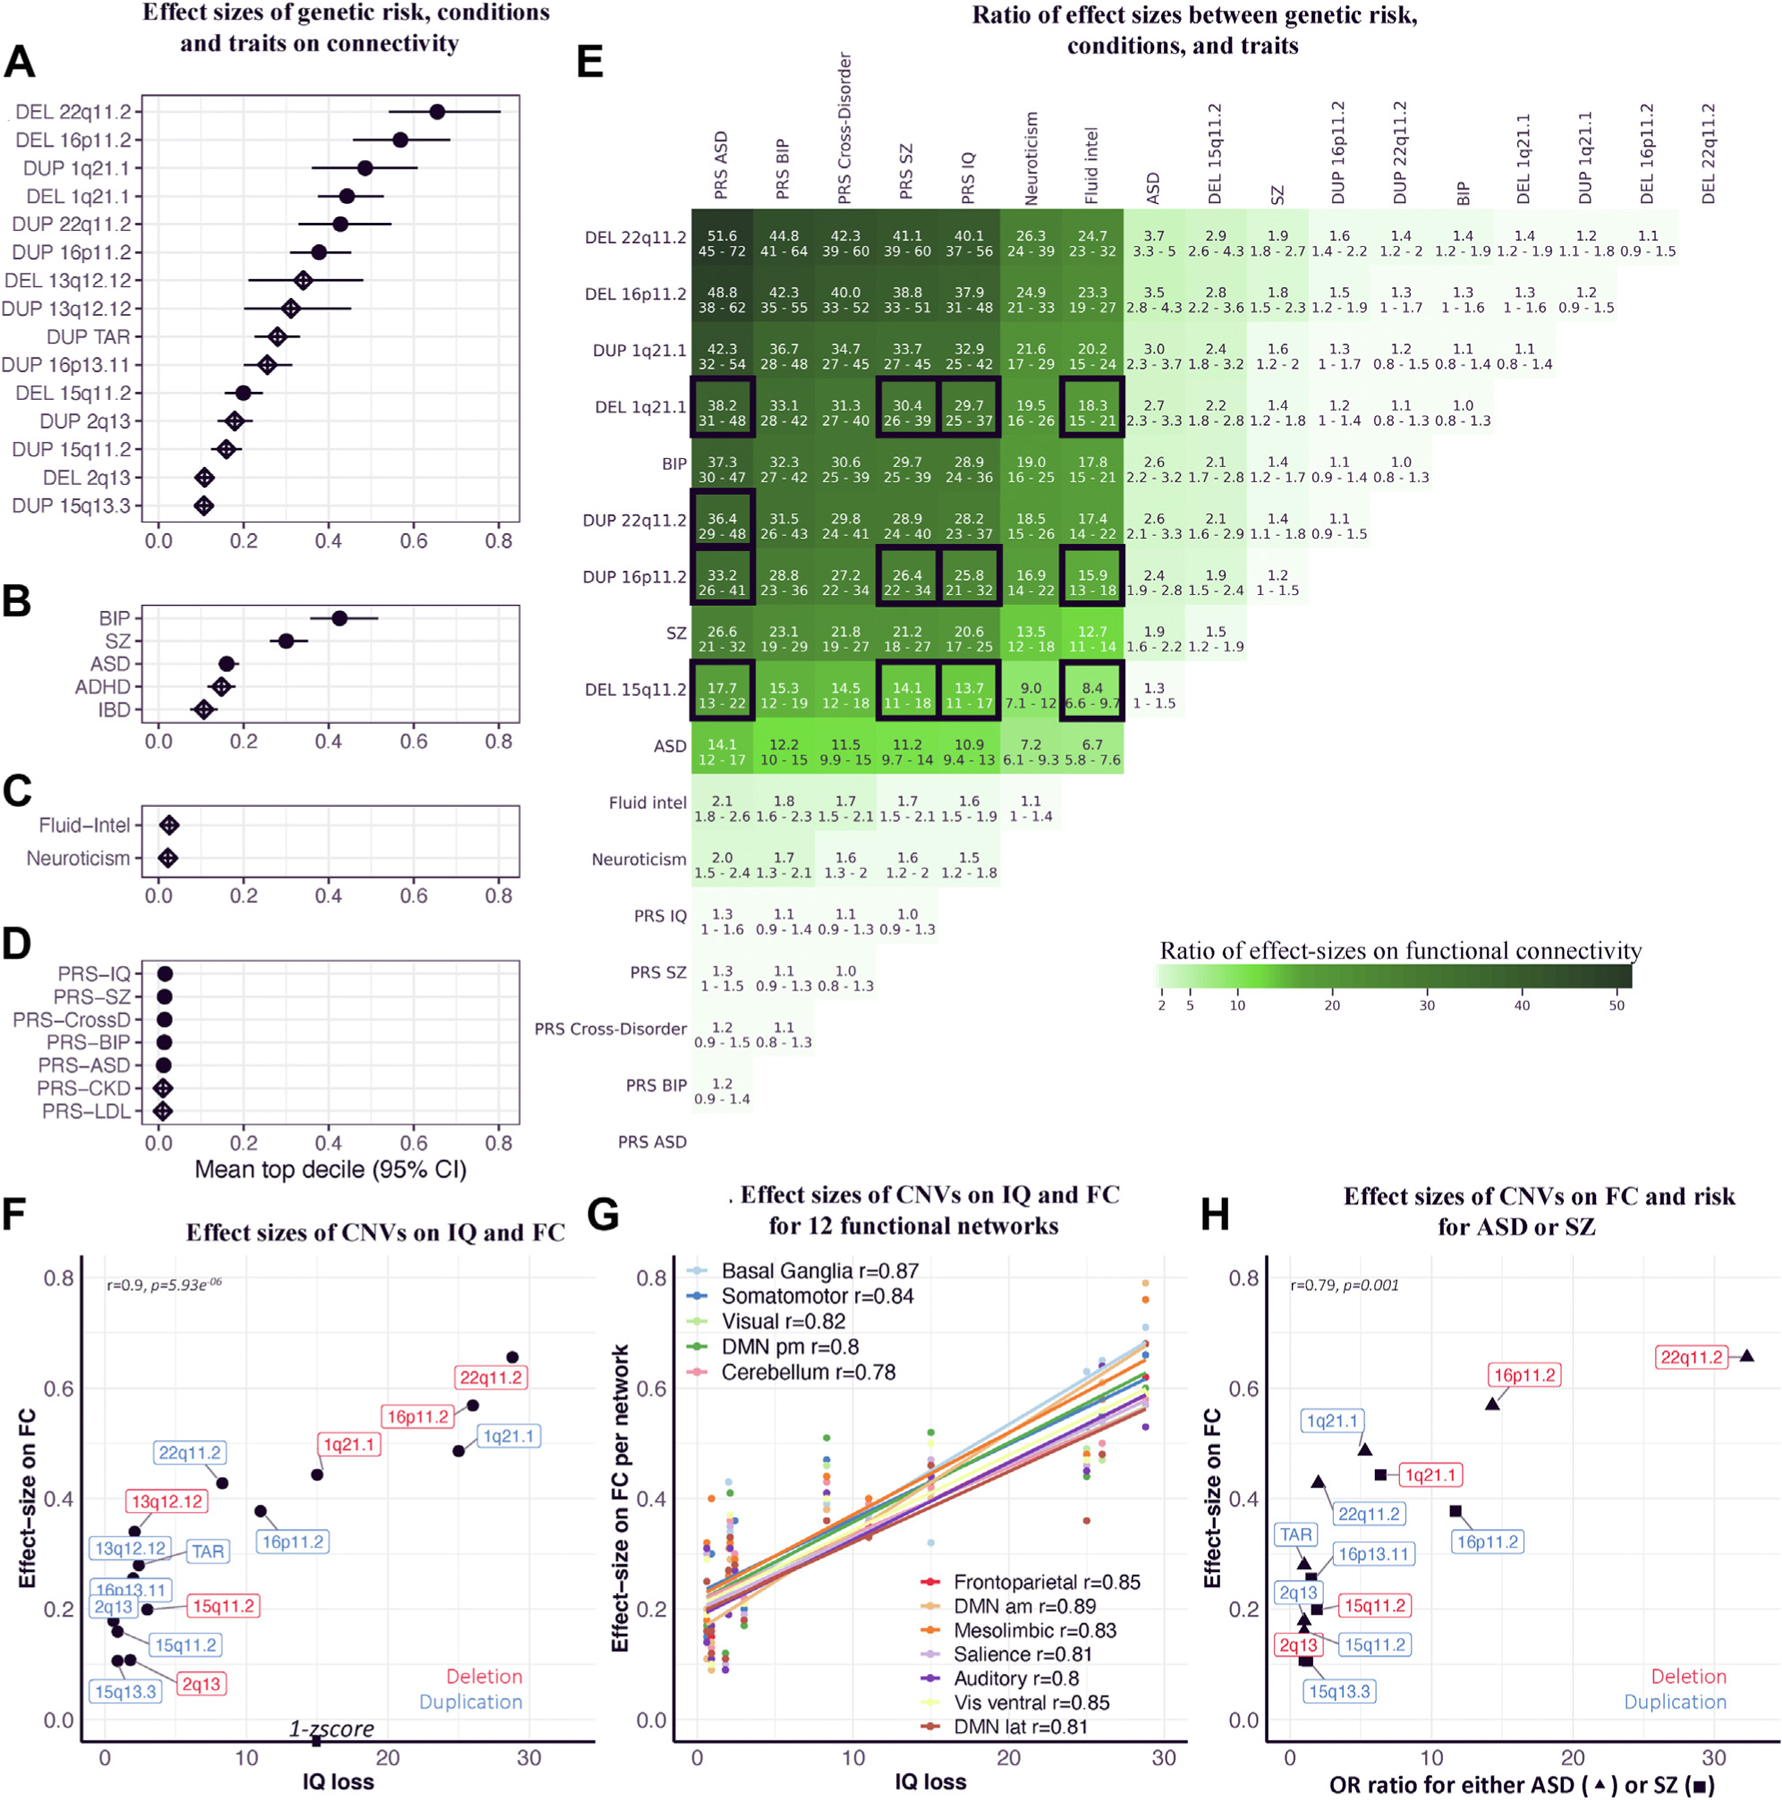
Figure 2.

Relation between effect sizes of CNVs on cognition and connectivity. (A–D) Effect size of genetic risk, conditions, and traits on FC. Effect sizes of (A) CNVs, (B) idiopathic psychiatric conditions, (C) traits, and (D) PRSs on FC. Each dot (or diamond) is the mean of estimates in the top decile (the 208 connections with the highest estimates). x-axis values represent the effect sizes -scored on the variance of the control group. Full dots represent significant effect sizes (the intersection of FC profiles with altered connections surviving false discovery rate and empirical p values using 5000 permutation tests q < 0.05) (Table 3), and empty diamonds are nonsignificant effect sizes. (E) Ratio of effect sizes between genetic risk, conditions, and traits. Ratios are only computed for groups that have significant effect sizes on FC. The ratio is the line (numerator) divided by the column (denominator). The 95% confidence interval for each ratio was computed using a bootstrap procedure (43,46) (see Methods and Materials). Boxes with black borders highlight CNVs and PRSs that should have similar effects on connectivity because they are matched for effect size on cognition or risk for disease. We also highlight CNVs that have effect sizes on cognitive ability equal or smaller than 1 score to highlight the discordance with effect of 1 score of fluid intelligence on connectivity. (F) Effect sizes of CNVs on IQ and FC. We used previously published effect sizes of CNVs on IQ (7). The x-axis indicates decrease in IQ associated with each CNV. The y-axis indicates effect sizes of CNVs on FC (top decile of estimates). (G) Effect sizes of CNVs on IQ and FC for 12 functional networks. The x-axis indicates decrease in IQ associated with each CNV (7). The y-axis indicates effect sizes of CNVs on FC for 12 functional networks (mean of the top decile of network-wide estimates) (For a representation of each network individually, see eFigure 5 in the Supplement). (H) Effect sizes of CNVs on FC and risk for autism or SZ. Correlation between previously published effect sizes of CNVs on autism or SZ risk (4,26,28,52) and their effect sizes on FC. We used the highest risk conferred by each CNV for either autism (26,28) or SZ (4,52). The x-axis indicates odd ratios for autism (▲) or SZ (■). The y-axis indicates effect sizes on FC (top decile of estimates). ADHD, attention-deficit/hyperactivity disorder; am, anteromedial; ASD, autism spectrum disorder; BIP, bipolar disorder; CKD, chronic kidney disease; CNV, copy number variant; CrossD, cross-disorder; DEL, deletion; DMN, default mode network; DUP, duplication; FC, functional connectivity; FP, frontoparietal network; IBD, inflammatory bowel disease; intel, intelligence; lat, lateral; LDL, low-density lipoprotein; OR, odds ratio; pm, posteromedial; PRS, polygenic risk score; SZ, schizophrenia; Vis, visual.
