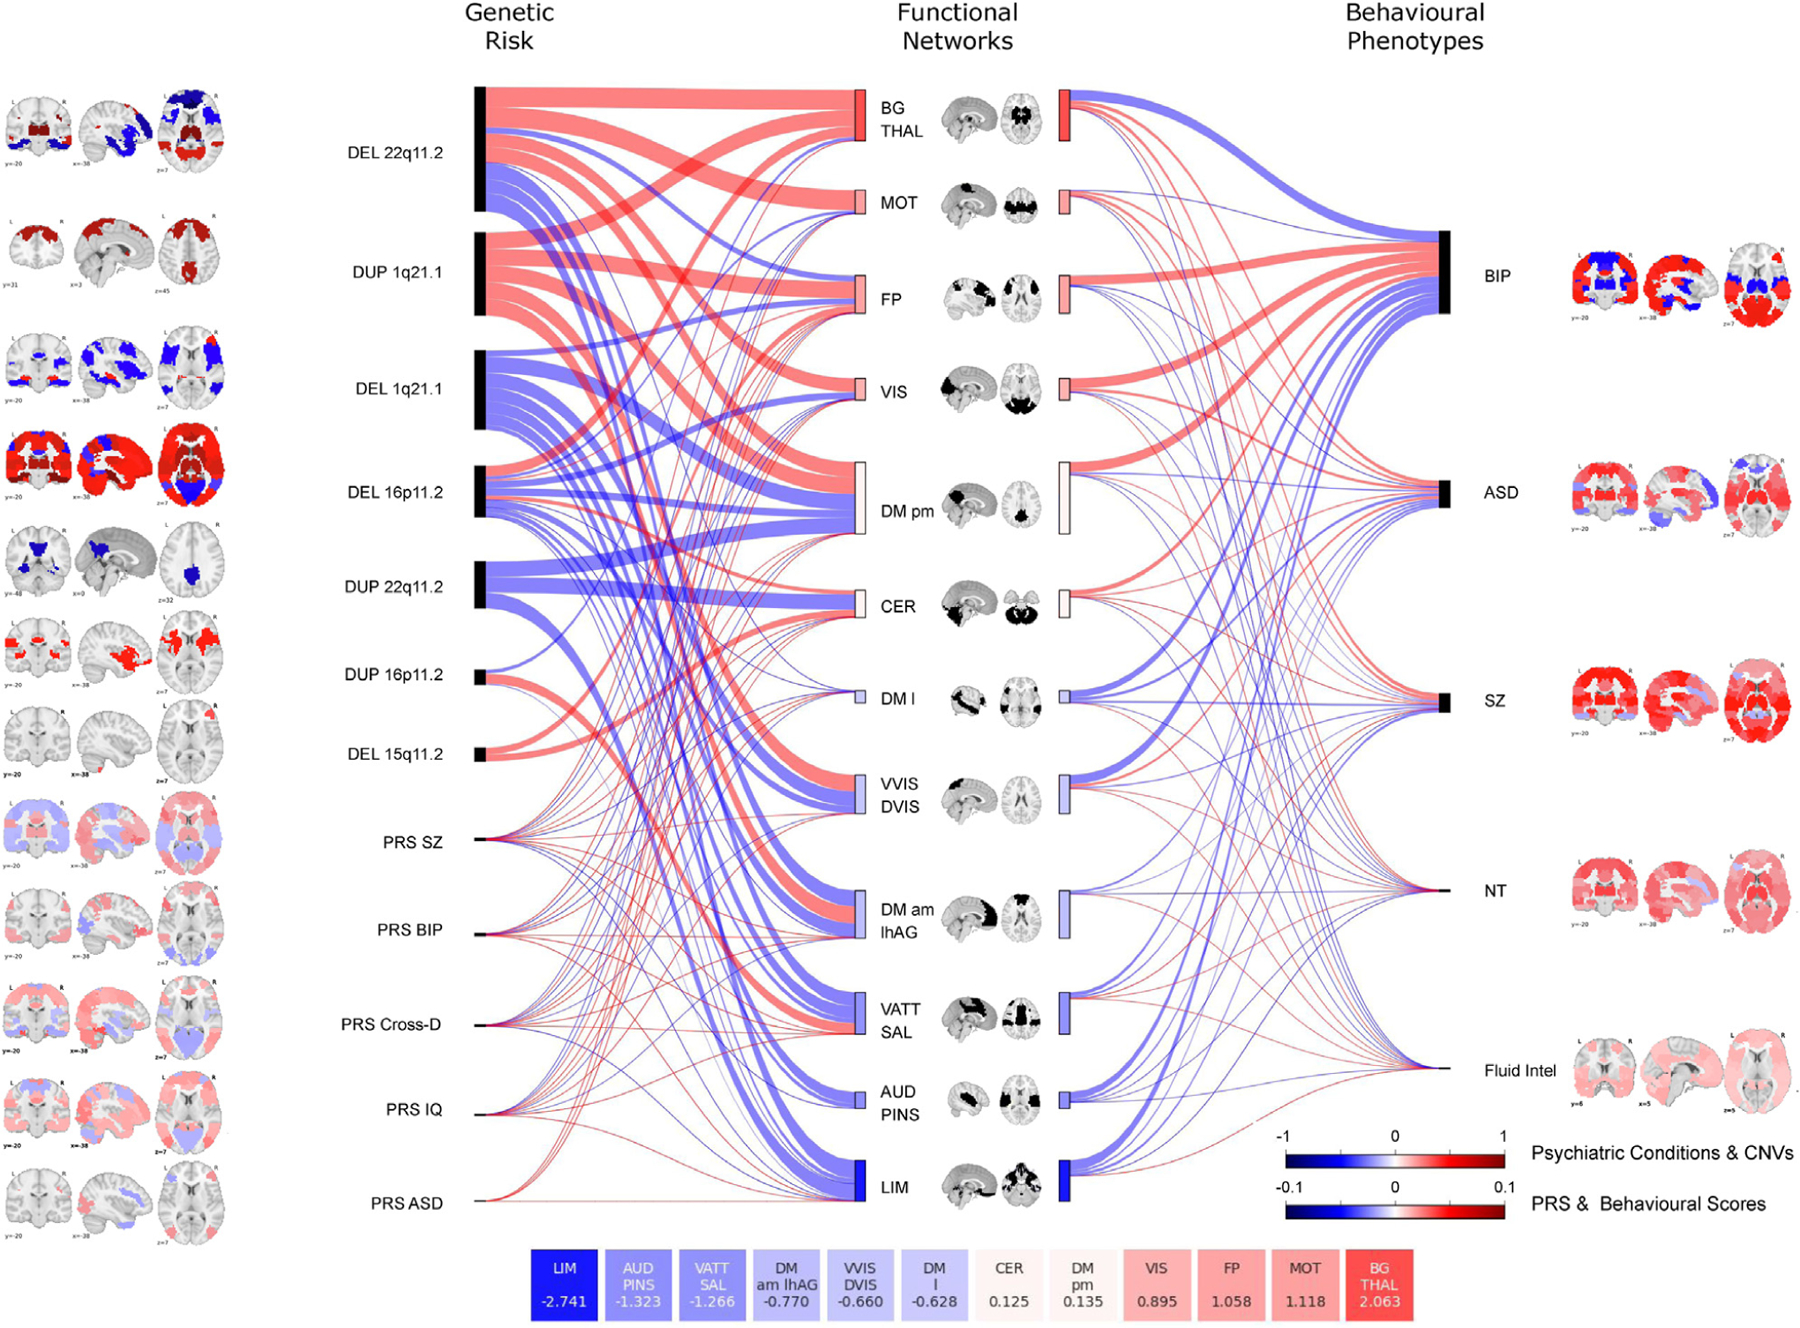
Figure 3.

Similarities at the network level across genetic risks, psychiatric conditions, and traits. Sankey plot shows effect sizes across 12 networks for genetic risk (left) and conditions, and traits (right). The thickness of the connecting lines represents these effect sizes, which were defined as the mean value of all significant connections within the network and between the network and the other 11 networks. The length and color of rectangles on either side of each network in the middle of the Sankey plot represents the sum of effect sizes across all genetic risks, conditions, and traits for that particular network. For each network, effect size values are summarized in the 12 boxes (bottom of the figure). Brain maps represent the maximum estimate value for each functional region (Table 3). Red indicates overconnectivity; blue indicates underconnectivity. Color bars represent the value. ASD, autism spectrum disorder; AUD PINS, auditory network and posterior insula; BG Thal, basal ganglia thalamus; BIP, bipolar disorder; CER, cerebellum; Cross-D, cross-disorder; CNV, copy number variant; DEL, deletion; DM am lhAG, default mode network anteromedial and left angular gyrus; DM l, default mode network lateral; DM pm, default mode network posteromedial; DUP, duplication; Fluid intel, fluid intelligence; FP, frontoparietal network; LIM, limbic network; MOT, somatomotor network; NT, neuroticism; PRS, polygenic risk score; SZ, schizophrenia; VATT SAL, ventral attentional and salience network; VIS, visual network; VVIS DVIS, ventral and dorsal visual network.
